Matplotlib是Python中的一個庫,它是數字的-NumPy庫的數學擴展。它是Python中令人驚歎的可視化庫,用於數組的2D圖,並用於與更廣泛的SciPy堆棧配合使用。
Matplotlib.axis.Axis.get_tightbbox()函數
matplotlib庫的軸模塊中的Axis.get_tightbbox()函數用於獲取包圍軸的邊界框。
用法: Axis.get_tightbbox(self, renderer)
參數:此方法接受以下參數。
- renderer:此參數是RendererBase實例
渲染器
返回值:此方法返回包圍軸的邊界框。
以下示例說明了matplotlib.axis中的matplotlib.axis.Axis.get_tightbbox()函數:
範例1:
Python3
# Implementation of matplotlib function
from matplotlib.axis import Axis
import matplotlib.pyplot as plt
import numpy as np


X = np.arange(-10, 10, 0.5)
Y = np.arange(-10, 10, 0.5)
U, V = np.meshgrid(X, Y)

fig, ax = plt.subplots()
ax.quiver(X, Y, U, V)
ax.invert_xaxis()
w = Axis.get_tightbbox(ax.xaxis, fig.canvas.get_renderer())

print("Value Return:\n"+str(w))
ax.grid()

fig.suptitle("""matplotlib.axis.Axis.get_tightbbox()
function Example\n""", fontweight ="bold")

plt.show()
輸出:
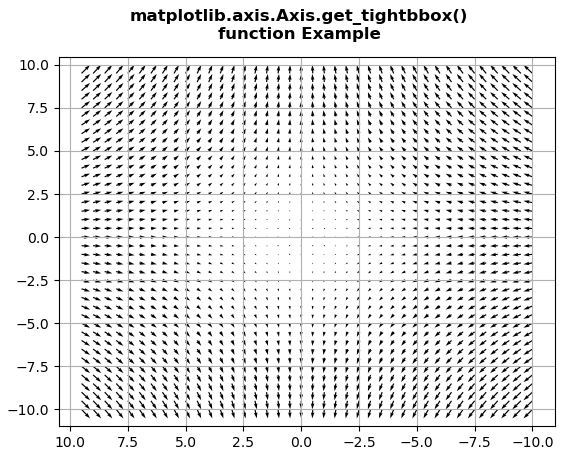
Value Return:
Bbox(x0=75.48368298368294, y0=29.077777777777776, x1=574.7670454545455, y1=43.077777777777776)
範例2:
Python3
# Implementation of matplotlib function
from matplotlib.axis import Axis
import numpy as np
import matplotlib.pyplot as plt

xx = np.random.rand(8, 6)

fig, ax = plt.subplots()

m = ax.pcolor(xx)
m.set_zorder(-2)
w = Axis.get_tightbbox(ax.xaxis, fig.canvas.get_renderer())

print("Value Return:\n"+str(w))
ax.grid()

fig.suptitle("""matplotlib.axis.Axis.get_tightbbox()
function Example\n""", fontweight ="bold")

plt.show()
輸出:
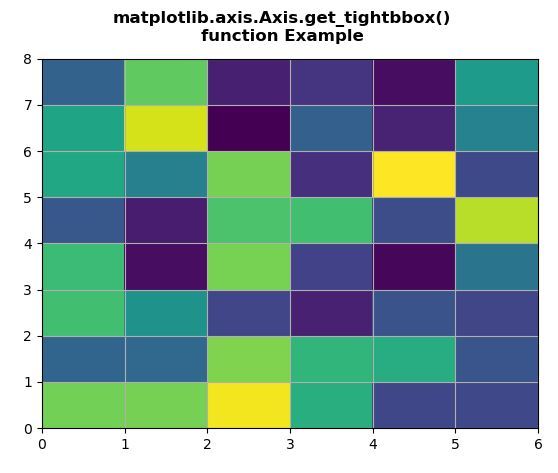
Value Return:
Bbox(x0=75.5625, y0=29.077777777777776, x1=580.4375, y1=43.077777777777776)
相關用法
- Python Wand function()用法及代碼示例
- Python sum()用法及代碼示例
- Python id()用法及代碼示例
- Python oct()用法及代碼示例
- Python int()用法及代碼示例
- Python cmp()用法及代碼示例
- Python tell()用法及代碼示例
- Python str()用法及代碼示例
- Python ord()用法及代碼示例
- Python hex()用法及代碼示例
- Python dir()用法及代碼示例
- Python map()用法及代碼示例
- Python now()用法及代碼示例
- Python globals()用法及代碼示例
- Python cmath.sin()用法及代碼示例
注:本文由純淨天空篩選整理自SHUBHAMSINGH10大神的英文原創作品 Matplotlib.axis.Axis.get_tightbbox() function in Python。非經特殊聲明,原始代碼版權歸原作者所有,本譯文未經允許或授權,請勿轉載或複製。