Matplotlib是Python中的一個庫,它是數字的-NumPy庫的數學擴展。它是Python中令人驚歎的可視化庫,用於數組的2D圖,並用於與更廣泛的SciPy堆棧配合使用。
matplotlib.axis.Axis.get_gridlines()函數
matplotlib庫的軸模塊中的Axis.get_gridlines()函數用於獲取網格線作為Line2D實例的列表。
用法: Axis.get_gridlines(self)
參數:此方法不接受任何參數。
返回值:此方法將網格線作為Line2D實例的列表返回。
以下示例說明了matplotlib.axis中的matplotlib.axis.Axis.get_gridlines()函數:
範例1:
Python3
# Implementation of matplotlib function
from matplotlib.axis import Axis
import numpy as np
import matplotlib.pyplot as plt
import random

fig, ax2 = plt.subplots()
x = []

for i in range(1,11):
    j = random.randint(1,10)
    x.append(i*j)
ax2.plot(x)

print("Value of get_gridlines():")
for i in ax2.xaxis.get_gridlines():
    print(i)

fig.suptitle("Matplotlib.axis.Axis.get_gridlines()\
Function Example", fontsize = 12, fontweight ='bold')

plt.show()
輸出:

Value of get_gridlines():
Line2D((0,0),(0,1))
Line2D((0,0),(0,1))
Line2D((0,0),(0,1))
Line2D((0,0),(0,1))
Line2D((0,0),(0,1))
Line2D((0,0),(0,1))
Line2D((0,0),(0,1))
範例2:
Python3
# Implementation of matplotlib function
from matplotlib.axis import Axis
import matplotlib.pyplot as plt
import matplotlib.text

fig, ax = plt.subplots()

ax.plot([5,1], label="Label 1")
ax.plot([3,0], label="Label 2")

legend = ax.legend(loc="upper right")
offset = matplotlib.text.OffsetFrom(legend, (1.0, 0.0))

ax.annotate("String - Info",
            xy = (0,0),
            size = 14,
            xycoords = 'figure fraction',
            xytext = (0,-20),
            textcoords = offset,
            horizontalalignment = 'right',
            verticalalignment = 'top')

fig.canvas.draw()
ax.grid()

print("Value of get_gridlines():")
for i in ax.yaxis.get_gridlines():
    print(i)

fig.suptitle("Matplotlib.axis.Axis.get_gridlines()\
Function Example", fontsize = 12, fontweight ='bold')

plt.show()
輸出:
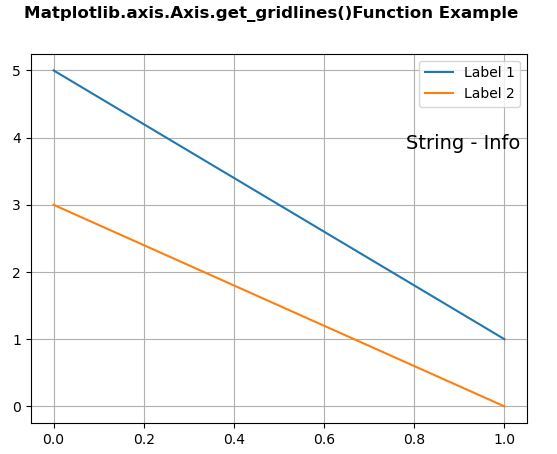
Value of get_gridlines():
Line2D((0,0),(1,0))
Line2D((0,0),(1,0))
Line2D((0,0),(1,0))
Line2D((0,0),(1,0))
Line2D((0,0),(1,0))
Line2D((0,0),(1,0))
Line2D((0,0),(1,0))
Line2D((0,0),(1,0))
相關用法
- Python Wand function()用法及代碼示例
- Python ord()用法及代碼示例
- Python oct()用法及代碼示例
- Python cmp()用法及代碼示例
- Python sum()用法及代碼示例
- Python now()用法及代碼示例
- Python tell()用法及代碼示例
- Python hex()用法及代碼示例
- Python int()用法及代碼示例
- Python dir()用法及代碼示例
- Python str()用法及代碼示例
- Python map()用法及代碼示例
- Python id()用法及代碼示例
- Python cmath.cos()用法及代碼示例
- Python property()用法及代碼示例
- Python math.sin()用法及代碼示例
- Python type()用法及代碼示例
注:本文由純淨天空篩選整理自SHUBHAMSINGH10大神的英文原創作品 Matplotlib.axis.Axis.get_gridlines() function in Python。非經特殊聲明,原始代碼版權歸原作者所有,本譯文未經允許或授權,請勿轉載或複製。