Matplotlib是Python中的一個庫,它是數字的-NumPy庫的數學擴展。它是Python中令人驚歎的可視化庫,用於數組的2D圖,並用於與更廣泛的SciPy堆棧配合使用。
matplotlib.axis.Axis.axis_date()函數
matplotlib庫的軸模塊中的Axis.axis_date()函數用於設置軸刻度和標簽,並將沿著該軸的數據視為日期。
用法: Axis.axis_date(self, tz=None)
參數:此方法接受以下參數。
- tz:此參數是用於創建日期標簽的時區。
返回值:此方法不返回任何值。
以下示例說明了matplotlib.axis中的matplotlib.axis.Axis.axis_date()函數:
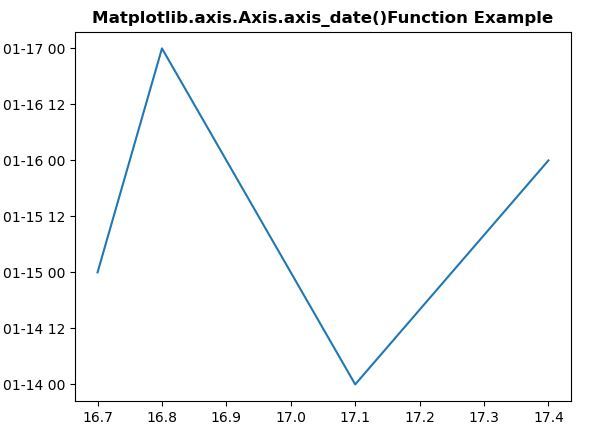
範例1:
Python3
# Implementation of matplotlib function
from matplotlib.axis import Axis
import datetime as dt
import matplotlib.pyplot as plt
from matplotlib.dates import DateFormatter, MinuteLocator

x = [16.7,16.8,17.1,17.4]
y = [15,17,14,16]
plt.plot(x, y)

plt.gca().yaxis.axis_date()

plt.title("Matplotlib.axis.Axis.axis_date()\
Function Example", fontsize = 12, fontweight ='bold')

plt.show()
輸出:
範例2:
Python3
# Implementation of matplotlib function
from matplotlib.axis import Axis
from datetime import datetime
import matplotlib.pyplot as plt
from matplotlib.dates import (
    DateFormatter, AutoDateLocator, AutoDateFormatter, datestr2num
)


days = [
    '30/01/2019',
    '31/01/2019',
    '01/02/2019',
    '02/02/2019',
    '03/02/2019',
    '04/02/2019'
]
data1 = [2, 5, 13, 6, 11, 7]
data2 = [6, 3, 10, 3, 6, 5]

z = datestr2num([
    datetime.strptime(day, '%d/%m/%Y').strftime('%m/%d/%Y')
    for day in days
])

r = 0.25

figure = plt.figure(figsize =(8, 4))
axes = figure.add_subplot(111)

axes.bar(z - r, data1, width = 2 * r,
         color ='g', align ='center',
         tick_label = days)
axes.bar(z + r, data2, width = 2 * r,
         color ='y', align ='center',
         tick_label = days)

axes.xaxis.axis_date()

plt.title("Matplotlib.axis.Axis.axis_date()\
Function Example", fontsize = 12, fontweight ='bold')

plt.show()
輸出:
相關用法
- Python Wand function()用法及代碼示例
- Python hex()用法及代碼示例
- Python tell()用法及代碼示例
- Python sum()用法及代碼示例
- Python oct()用法及代碼示例
- Python id()用法及代碼示例
- Python now()用法及代碼示例
- Python str()用法及代碼示例
- Python map()用法及代碼示例
- Python cmp()用法及代碼示例
- Python ord()用法及代碼示例
- Python dir()用法及代碼示例
- Python int()用法及代碼示例
- Python Wand fx()用法及代碼示例
- Python property()用法及代碼示例
- Python ldexp()用法及代碼示例
- Python fmod()用法及代碼示例
注:本文由純淨天空篩選整理自SHUBHAMSINGH10大神的英文原創作品 Matplotlib.axis.Axis.axis_date() function in Python。非經特殊聲明,原始代碼版權歸原作者所有,本譯文未經允許或授權,請勿轉載或複製。