此函數創建曲麵圖。
用法
surf(Z) //  It creates a three-dimensional shaded surface from the z components in matrix Z, using x = 1:n and y = 1:m, where [m,n] = size(Z).
surf(X,Y,Z) // It creates a shaded surface using Z for the color information as well as surface height. X and Y are vectors or matrices describing the x and y components of a surface.
surf(X,Y,Z,C) // It creates a shaded surface, with color defined by C.
surf(...,'PropertyName',PropertyValue) // It specifies surface properties along with the data.
surfc(...) // It draws a contour plot beneath the surface.
h = surf(...) // It return a handle to a surface graphics object.
h = surfc(...) // It return a handle to a surface graphics object.
示例
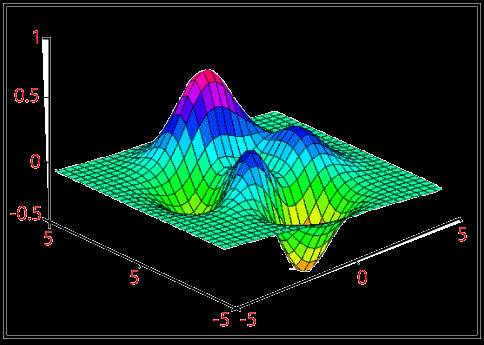
z=cos x cos y e (-√(x^2+y^2 ))/4
|x|≤5,|y|≤5
u=-5:.2:5;
[X, Y]=meshgrid(u, u);
Z=cos(X). *cos(Y).*...
    exp (-sqrt(X.^2+Y.^2)/4);
surf(X, Y, Z)
輸出:
相關用法
- MATLAB surfc()用法及代碼示例
- MATLAB stem3()用法及代碼示例
- MATLAB slice()用法及代碼示例
- MATLAB sphere()用法及代碼示例
- MATLAB stem()用法及代碼示例
- MATLAB meshz()用法及代碼示例
- MATLAB contour()用法及代碼示例
- MATLAB loglog()用法及代碼示例
- MATLAB ribbon()用法及代碼示例
- MATLAB comet()用法及代碼示例
- MATLAB Stairs()用法及代碼示例
- MATLAB pcolor()用法及代碼示例
- MATLAB Bar()用法及代碼示例
- MATLAB contour3()用法及代碼示例
- MATLAB barh()用法及代碼示例
- MATLAB area()用法及代碼示例
- MATLAB waterfall()用法及代碼示例
- MATLAB quiver()用法及代碼示例
- MATLAB Semilogy()用法及代碼示例
- MATLAB plotyy()用法及代碼示例
注:本文由純淨天空篩選整理自 MATLAB surf()。非經特殊聲明,原始代碼版權歸原作者所有,本譯文未經允許或授權,請勿轉載或複製。