條形圖是每個點由垂直條或水平條表示的圖。
用法
bar(y) // It creates a bar graph with one bar for each element in y.
bar (x, y) // This function creates a vertical bar plot, with the values in x used to label each bar and the values in y used to determine the height of the bar.
示例
創建條形圖
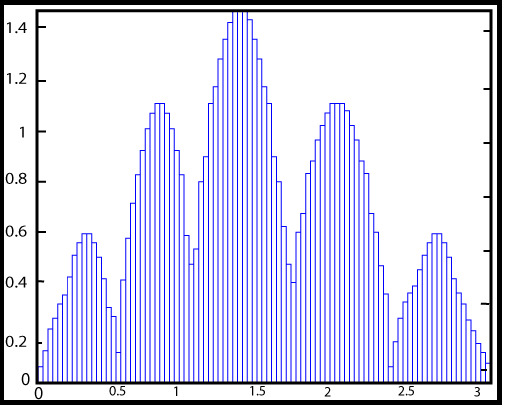
r^2=2 sin 5t, 0≤t≤2π
y = r sin t
t=linspace (0, 2*pi,200);
r=sqrt(abs(2*sin(5*t)));
y=r.*sin(t);
bar (t, y)
axis ([0 pi 0 inf]);
輸出:
相關用法
- MATLAB meshz()用法及代碼示例
- MATLAB contour()用法及代碼示例
- MATLAB loglog()用法及代碼示例
- MATLAB ribbon()用法及代碼示例
- MATLAB comet()用法及代碼示例
- MATLAB Stairs()用法及代碼示例
- MATLAB pcolor()用法及代碼示例
- MATLAB contour3()用法及代碼示例
- MATLAB barh()用法及代碼示例
- MATLAB area()用法及代碼示例
- MATLAB stem3()用法及代碼示例
- MATLAB waterfall()用法及代碼示例
- MATLAB quiver()用法及代碼示例
- MATLAB slice()用法及代碼示例
- MATLAB Semilogy()用法及代碼示例
- MATLAB plotyy()用法及代碼示例
- MATLAB fill3()用法及代碼示例
- MATLAB fill()用法及代碼示例
- MATLAB cylinder()用法及代碼示例
- MATLAB ellipsoid()用法及代碼示例
注:本文由純淨天空篩選整理自 MATLAB Bar()。非經特殊聲明,原始代碼版權歸原作者所有,本譯文未經允許或授權,請勿轉載或複製。