二維莖圖將數據顯示為從基線沿 x 軸延伸的線。 y-position 代表數據值的圓圈(默認)或其他標記終止每個詞幹。
用法
stem(Y) // It plots the data sequence Y as stems that extends from equally spaced and automatically created values along the x-axis. When Y is a matrix, stem plot, all items in a row against the same x value.
stem(X,Y) // It plot X versus the column of Y. X and Y are vectors or matrices of a similar size. X can be the row or a column vector, and Y is a matrix with length(X) rows.
stem(...,'fill') // It specifies whether to color the circle at the end of the stem.
stem(...,LineSpec) // It specifies the line style, marker symbol, and color.
h = stem(...) // It returns a vector of Stem objects in h.
示例
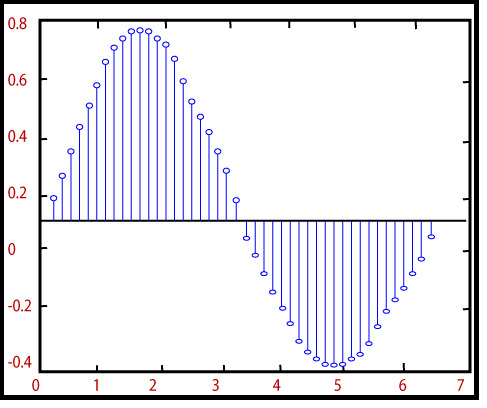
f=e^-t/5 sint,0â¤tâ¤2Ď
t=linspace (0, 2*pi, 200);
f=exp (-.2*t).*sin(t);
stem(t, f)輸出:
相關用法
- MATLAB stem3()用法及代碼示例
- MATLAB slice()用法及代碼示例
- MATLAB surf()用法及代碼示例
- MATLAB sphere()用法及代碼示例
- MATLAB surfc()用法及代碼示例
- MATLAB meshz()用法及代碼示例
- MATLAB contour()用法及代碼示例
- MATLAB loglog()用法及代碼示例
- MATLAB ribbon()用法及代碼示例
- MATLAB comet()用法及代碼示例
- MATLAB Stairs()用法及代碼示例
- MATLAB pcolor()用法及代碼示例
- MATLAB Bar()用法及代碼示例
- MATLAB contour3()用法及代碼示例
- MATLAB barh()用法及代碼示例
- MATLAB area()用法及代碼示例
- MATLAB waterfall()用法及代碼示例
- MATLAB quiver()用法及代碼示例
- MATLAB Semilogy()用法及代碼示例
- MATLAB plotyy()用法及代碼示例
注:本文由純淨天空篩選整理自 MATLAB stem()。非經特殊聲明,原始代碼版權歸原作者所有,本譯文未經允許或授權,請勿轉載或複製。