當箭頭從原點出現時,羅盤圖顯示方向或速度矢量。 X、Y 和 Z 在笛卡爾坐標中並繪製在圓形網格上。
用法
compass(X,Y) // It shows the compass plot having n arrows, where n is the number of components in X or Y. The area of the base of each arrow is the origin.
compass(Z) // It displays a compass plot having n arrows, where n is the number of elements in Z.
compass(...,LineSpec) // It draws a compass plot using the line type, marker symbol, and color specified by LineSpec.
h = compass(...)// It returns handles to line objects.
示例
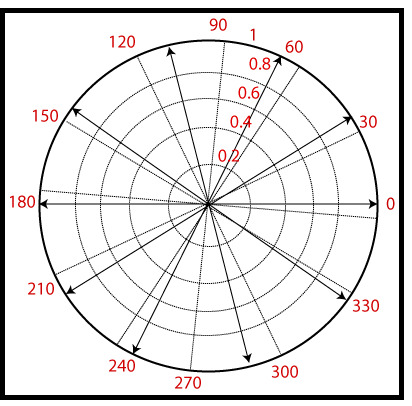
z=cosθ+isinθ,-π≤θ≤π
th=-pi:pi/5:pi;
zx=cos(th);
zy=sin(th);
z=zx+i*zy;
compass(z)
輸出:
相關用法
- MATLAB comet()用法及代碼示例
- MATLAB contour()用法及代碼示例
- MATLAB contour3()用法及代碼示例
- MATLAB cylinder()用法及代碼示例
- MATLAB meshz()用法及代碼示例
- MATLAB loglog()用法及代碼示例
- MATLAB ribbon()用法及代碼示例
- MATLAB Stairs()用法及代碼示例
- MATLAB pcolor()用法及代碼示例
- MATLAB Bar()用法及代碼示例
- MATLAB barh()用法及代碼示例
- MATLAB area()用法及代碼示例
- MATLAB stem3()用法及代碼示例
- MATLAB waterfall()用法及代碼示例
- MATLAB quiver()用法及代碼示例
- MATLAB slice()用法及代碼示例
- MATLAB Semilogy()用法及代碼示例
- MATLAB plotyy()用法及代碼示例
- MATLAB fill3()用法及代碼示例
- MATLAB fill()用法及代碼示例
注:本文由純淨天空篩選整理自 MATLAB compass()。非經特殊聲明,原始代碼版權歸原作者所有,本譯文未經允許或授權,請勿轉載或複製。