points 位于 graphics 包(package)。 说明
points 是一个通用函数,用于在指定坐标处绘制一系列点。以坐标为中心绘制指定的字符。
用法
points(x, ...)

## Default S3 method:
points(x, y = NULL, type = "p", ...)
参数
x, y |
要绘制的点的坐标向量。 |
type |
指示绘图类型的字符;实际上任何 |
... |
另外graphical parameters也可以作为参数提供。查看具体信息'。 |
细节
坐标可以在绘图结构(包含 x 和 y 组件的列表)、两列矩阵、时间序列等中传递。请参阅 xy.coords 。如果单独提供,它们的长度必须相同。
常用的图形参数有
pch-
绘制‘character’,即要使用的符号。这可以是单个字符,也可以是一组图形符号之一的整数代码。全套 S 符号可用于
pch = 0:18,请参阅下面的示例。 (注意:R使用圆形而不是 S 中使用的八边形。)值
pch = "."(相当于pch = 46)经过特殊处理。它是一个边长为 0.01 英寸的矩形(按cex缩放)。此外,如果cex = 1(默认值),则每边至少为一个像素(在pdf、postscript和xfig设备上为 1/72 英寸)。对于其他文本符号,
cex = 1对应于设备的默认字体大小,通常由参数pointsize指定。对于0:25中的pch,默认大小约为字符高度的 75%(请参阅par("cin"))。 col-
颜色代码或名称,请参阅
par。 bg-
pch = 21:25给出的开放图符号的背景(填充)颜色。 cex-
字符(或符号)扩展:数值向量。这是
par("cex")的倍数。 lwd-
绘图符号的线宽请参见
par。
其他不太常用的是 lty 和 lwd 等类型,例如 "b" 和 "l" 。
graphical parameters pch 、 col 、 bg 、 cex 和 lwd 可以是向量(将根据需要回收),为绘制的每个点提供一个值。如果要绘制线条(例如,对于 type = "b" ),则使用 lwd 的第一个元素。
图中省略 x 、 y 、 pch 、 col 或 cex 值为 NA 的点。
'pch'值
pch 的值在内部存储为整数。解释是
-
NA_integer_:无符号。 -
0:18:S-compatible矢量符号。 -
19:25: 更远R矢量符号。 -
26:31:未使用(并被忽略)。 -
32:127:ASCII 字符。 -
128:255仅适用于单字节语言环境和符号字体的本机字符。 (128:159仅在 Windows 上使用。) -
-32 ...Unicode 代码点(如果支持)。
请注意,与 S(使用八边形)不同,符号 1 、 10 、 13 和 16 使用圆形。填充形状15:18不包含边框。
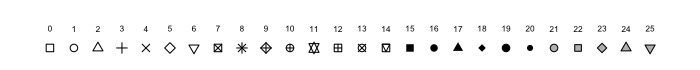
下列R绘图符号可以通过以下方式获得pch = 19:25: 那些有21:25可以着色并填充不同的颜色:col给出边框颜色和bg背景颜色(即‘"grey"’图中)
-
pch = 19:实心圆, -
pch = 20:项目符号(较小的实心圆,19大小的 2/3), -
pch = 21:实心圆, -
pch = 22:实心正方形, -
pch = 23:填充钻石, -
pch = 24:实心三角形point-up, -
pch = 25:实心三角形点向下。
请注意,所有这些都填充形状并绘制边框。当半透明颜色用于填充和边框时,在解释时需要注意(结果可能是特定于设备的,甚至是 viewer-specific for pdf )。
pch = 16 和 pch = 19 之间的区别在于,后者使用边框,因此当 lwd 相对于 cex 较大时,后者明显更大。
值 pch = 26:31 当前未使用,pch = 32:127 给出 ASCII 字符。在单字节语言环境中 pch = 128:255 给出语言环境字符集中的相应字符(如果有)。在操作系统支持的情况下,负值指定 Unicode 代码点,例如-0x2642L 是“男性标志”,-0x20ACL 是欧元。
由单个字符组成的字符串将转换为整数:对于 ASCII 字符,32:127,否则通常转换为 Unicode 代码点。 (在非 Latin-1 单字节语言环境中,128:255 将用于 8 位字符。)
如果提供的 pch 是逻辑、整数或字符 NA 或空字符串,则该点将从图中省略。
如果pch是NULL或者长度为0,则使用par("pch")。
如果使用符号字体 ( par(font = 5) ),则 pch 应使用数值:所有区域设置中的范围为 c(32:126, 160:254) (但 240 未定义(用于 macOS 上的 ‘apple’)并且 160,欧元,可能不存在)。
注意
单字节编码可能包含 pch = 128:255 中的字符,如果包含,字体可能不包含所有(甚至任何)它们。
并非所有负数都可以作为 Unicode 代码点,并且不会进行任何检查。显示设备可能会使用矩形(或省略)无效的或在所使用的字体中没有字形的 Unicode 代码点。
cex 的值非常小或为零时,会发生 device-dependent:符号或字符可能变得不可见,或者可能以固定的最小尺寸绘制。不会绘制半径为零的圆。
例子
require(stats) # for rnorm
plot(-4:4, -4:4, type = "n")  # setting up coord. system
points(rnorm(200), rnorm(200), col = "red")
points(rnorm(100)/2, rnorm(100)/2, col = "blue", cex = 1.5)

op <- par(bg = "light blue")
x <- seq(0, 2*pi, length.out = 51)
## something "between type='b' and type='o'":
plot(x, sin(x), type = "o", pch = 21, bg = par("bg"), col = "blue", cex = .6,
 main = 'plot(..., type="o", pch=21, bg=par("bg"))')
par(op)

## Not run:
## The figure was produced by calls like
png("pch.png", height = 0.7, width = 7, res = 100, units = "in")
par(mar = rep(0,4))
plot(c(-1, 26), 0:1, type = "n", axes = FALSE)
text(0:25, 0.6, 0:25, cex = 0.5)
points(0:25, rep(0.3, 26), pch = 0:25, bg = "grey")

## End(Not run)

##-------- Showing all the extra & some char graphics symbols ---------
pchShow <-
  function(extras = c("*",".", "o","O","0","+","-","|","%","#"),
           cex = 3, ## good for both .Device=="postscript" and "x11"
           col = "red3", bg = "gold", coltext = "brown", cextext = 1.2,
           main = paste("plot symbols :  points (...  pch = *, cex =",
                        cex,")"))
  {
    nex <- length(extras)
    np  <- 26 + nex
    ipch <- 0:(np-1)
    k <- floor(sqrt(np))
    dd <- c(-1,1)/2
    rx <- dd + range(ix <- ipch %/% k)
    ry <- dd + range(iy <- 3 + (k-1)- ipch %% k)
    pch <- as.list(ipch) # list with integers & strings
    if(nex > 0) pch[26+ 1:nex] <- as.list(extras)
    plot(rx, ry, type = "n", axes  =  FALSE, xlab = "", ylab = "", main = main)
    abline(v = ix, h = iy, col = "lightgray", lty = "dotted")
    for(i in 1:np) {
      pc <- pch[[i]]
      ## 'col' symbols with a 'bg'-colored interior (where available) :
      points(ix[i], iy[i], pch = pc, col = col, bg = bg, cex = cex)
      if(cextext > 0)
          text(ix[i] - 0.3, iy[i], pc, col = coltext, cex = cextext)
    }
  }

pchShow()
pchShow(c("o","O","0"), cex = 2.5)
pchShow(NULL, cex = 4, cextext = 0, main = NULL)


## ------------ test code for various pch specifications -------------
# Try this in various font families (including Hershey)
# and locales.  Use sign = -1 asserts we want Latin-1.
# Standard cases in a MBCS locale will not plot the top half.
TestChars <- function(sign = 1, font = 1, ...)
{
   MB <- l10n_info()$MBCS
   r <- if(font == 5) { sign <- 1; c(32:126, 160:254)
       } else if(MB) 32:126 else 32:255
   if (sign == -1) r <- c(32:126, 160:255)
   par(pty = "s")
   plot(c(-1,16), c(-1,16), type = "n", xlab = "", ylab = "",
        xaxs = "i", yaxs = "i",
        main = sprintf("sign = %d, font = %d", sign, font))
   grid(17, 17, lty = 1) ; mtext(paste("MBCS:", MB))
   for(i in r) try(points(i%%16, i%/%16, pch = sign*i, font = font,...))
}
TestChars()
try(TestChars(sign = -1))
TestChars(font = 5)  # Euro might be at 160 (0+10*16).
                     # macOS has apple at 240 (0+15*16).
try(TestChars(-1, font = 2))  # bold
参考
Becker, R. A., Chambers, J. M. and Wilks, A. R. (1988) The New S Language. Wadsworth & Brooks/Cole.
也可以看看
points.formula为公式方法; plot 、 lines 和底层主力函数 plot.xy 。
相关用法
- R polygon 多边形绘制
- R polypath 路径绘制
- R plot.histogram 绘制直方图
- R pairs 散点图矩阵
- R plot.raster 绘制光栅图像
- R plot.factor 绘制因子变量
- R plot.table 表对象的绘图方法
- R plot.default 默认散点图函数
- R plot.window 设置图形窗口的世界坐标
- R plot.xy 基本内部绘图函数
- R persp 透视图
- R pie 饼状图
- R par 设置或查询图形参数
- R panel.smooth 简单面板图
- R plot.design 绘制设计或模型的单变量效应
- R plot.formula 散点图的公式表示法
- R plot.data.frame DataFrame 的绘图方法
- R legend 将图例添加到绘图中
- R barplot 条形图
- R stem 茎叶图
- R mtext 将文本写入绘图的边距
- R arrows 将箭头添加到绘图中
- R contour 显示轮廓
- R stars 星图(蜘蛛图/雷达图)和线段图
- R box 在地块周围画一个方框
注:本文由纯净天空筛选整理自R-devel大神的英文原创作品 Add Points to a Plot。非经特殊声明,原始代码版权归原作者所有,本译文未经允许或授权,请勿转载或复制。