用法:
RandomState.noncentral_chisquare(df, nonc, size=None)从非中心chi-square分布中抽取样本。
非中心
 分布是对分配。
参数: - df: : float 或 array_like of floats
自由度必须> 0。
在1.10.0版中进行了更改:较早的NumPy版本要求dfnum> 1。
- nonc: : float 或 array_like of floats
非中心性,必须为非负性。
- size: : int 或 tuple of ints, 可选参数
输出形状。如果给定的形状是
(m, n, k), 然后m * n * k抽取样品。如果尺寸是None(默认),如果返回一个值df和nonc都是标量。除此以外,np.broadcast(df, nonc).size抽取样品。
返回值: - out: : ndarray或标量
从参数化的非中心chi-square分布中抽取样本。
注意:
非中心Chi-square分布的概率密度函数为

哪里
 是具有q个自由度的Chi-square。
参考文献:
[1] 维基百科,“非中央chi-squared分发”https://en.wikipedia.org/wiki/Noncentral_chi-squared_distribution 例子:
从分布中绘制值并绘制直方图
>>> import matplotlib.pyplot as plt
>>> values = plt.hist(np.random.noncentral_chisquare(3, 20, 100000),
...                   bins=200, density=True)
>>> plt.show()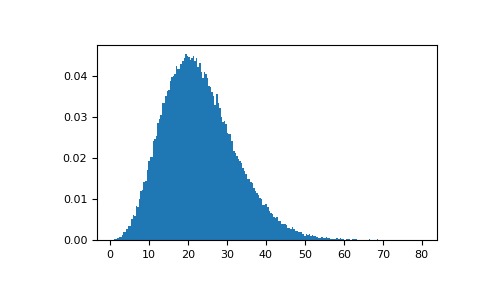
从具有非中心极小的非中心卡方绘制值,并将其与卡方进行比较。
>>> plt.figure()
>>> values = plt.hist(np.random.noncentral_chisquare(3, .0000001, 100000),
...                   bins=np.arange(0., 25, .1), density=True)
>>> values2 = plt.hist(np.random.chisquare(3, 100000),
...                    bins=np.arange(0., 25, .1), density=True)
>>> plt.plot(values[1][0:-1], values[0]-values2[0], 'ob')
>>> plt.show()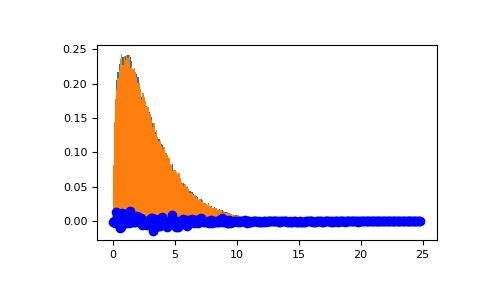
演示非中心度的大值如何导致更对称的分布。
>>> plt.figure()
>>> values = plt.hist(np.random.noncentral_chisquare(3, 20, 100000),
...                   bins=200, density=True)
>>> plt.show()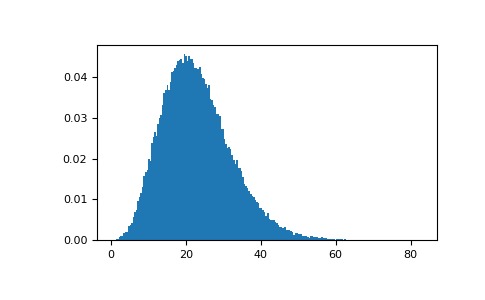
注:本文由纯净天空筛选整理自 numpy.random.mtrand.RandomState.noncentral_chisquare。非经特殊声明,原始代码版权归原作者所有,本译文未经允许或授权,请勿转载或复制。