用法:
RandomState.gumbel(loc=0.0, scale=1.0, size=None)从Gumbel分布中抽取样本。
从具有指定位置和比例的Gumbel分布中抽取样本。有关Gumbel分布的更多信息,请参见下面的注释和参考。
参数: - loc: : float 或 array_like of floats, 可选参数
分布方式的位置。默认值为0。
- scale: : float 或 array_like of floats, 可选参数
分布的比例参数。默认值为1。必须为非负数。
- size: : int 或 tuple of ints, 可选参数
输出形状。如果给定的形状是
(m, n, k), 然后m * n * k抽取样品。如果尺寸是None(默认),如果返回一个值loc和scale都是标量。除此以外,np.broadcast(loc, scale).size抽取样品。
返回值: - out: : ndarray或标量
从参数化的Gumbel分布中抽取样本。
注意:
Gumbel(或最小极值(SEV)或I最小极值类型)分布是用于建模极值问题的一类广义极值(GEV)分布之一。 Gumbel是I极值类型分布的一种特例,用于从具有“exponential-like”尾部的分布中获得最大值。
Gumbel分布的概率密度为

哪里
 是模式,位置参数,以及
 是scale参数。
Gumbel(以德国数学家Emil Julius Gumbel的名字命名)在水文学中很早就被用来模拟洪水事件的发生。它也用于建模最大风速和降雨量。它是“fat-tailed”分布-分布尾部发生事件的概率大于使用高斯分布的事件,因此令人惊讶地频繁发生了100年的洪水。洪水最初被建模为高斯过程,这高估了极端事件的发生频率。
它是一类极值分布,即通用极值(GEV)分布,其中还包括Weibull和Frechet。
该函数的平均值为
 和方差
和方差 。
。参考文献:
[1] E. J. Gumbel,“极端情况的统计”,纽约:哥伦比亚大学出版社,1958年。 [2] Reiss,R.-D.和Thomas M.,“来自保险,金融,水文学和其他领域的极值统计分析”,巴塞尔:Birkhauser Verlag,2001年。 例子:
从分布中抽取样本:
>>> mu, beta = 0, 0.1 # location and scale
>>> s = np.random.gumbel(mu, beta, 1000)
显示样本的直方图以及概率密度函数:
>>> import matplotlib.pyplot as plt
>>> count, bins, ignored = plt.hist(s, 30, density=True)
>>> plt.plot(bins, (1/beta)*np.exp(-(bins - mu)/beta)
...          * np.exp( -np.exp( -(bins - mu) /beta) ),
...          linewidth=2, color='r')
>>> plt.show()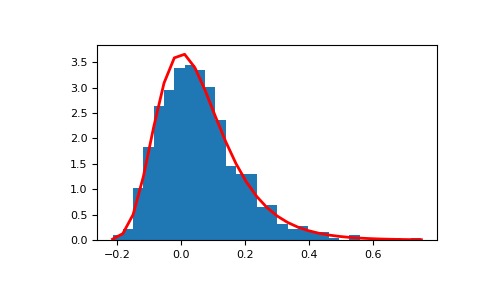
说明高斯过程如何产生极值分布,并与高斯进行比较:
>>> means = []
>>> maxima = []
>>> for i in range(0,1000) :
...    a = np.random.normal(mu, beta, 1000)
...    means.append(a.mean())
...    maxima.append(a.max())
>>> count, bins, ignored = plt.hist(maxima, 30, density=True)
>>> beta = np.std(maxima) * np.sqrt(6) / np.pi
>>> mu = np.mean(maxima) - 0.57721*beta
>>> plt.plot(bins, (1/beta)*np.exp(-(bins - mu)/beta)
...          * np.exp(-np.exp(-(bins - mu)/beta)),
...          linewidth=2, color='r')
>>> plt.plot(bins, 1/(beta * np.sqrt(2 * np.pi))
...          * np.exp(-(bins - mu)**2 / (2 * beta**2)),
...          linewidth=2, color='g')
>>> plt.show()
注:本文由纯净天空筛选整理自 numpy.random.mtrand.RandomState.gumbel。非经特殊声明,原始代码版权归原作者所有,本译文未经允许或授权,请勿转载或复制。