本文简要介绍 python 语言中 arcgis.geoanalytics.summarize_data.build_multivariable_grid 的用法。
用法:
arcgis.geoanalytics.summarize_data.build_multivariable_grid(input_layers, variable_calculations, bin_size, bin_unit='Meters', bin_type='Square', output_name=None, gis=None, future=False, context=None)返回:
布尔值
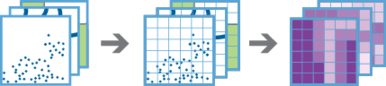
build_multivariable_grid任务适用于一层或多层点、线或面要素。该任务生成正方形或六边形 bin 的网格,并将有关每个输入层的信息编译到每个 bin 中。对于每个输入层,此信息可以包括以下变量:Distance to Nearest- The distance from each bin to the nearest feature.Attribute of Nearest- An attribute value of the feature nearest to each bin.Attribute Summary of Related- A statistical summary of all features withinsearch_distanceof each bin.
只有您在
variable_calculations中指定的变量才会包含在结果层中。这些变量可以帮助您了解整个分析范围内数据的接近程度。结果可以帮助您回答以下问题:Given multiple layers of public transportation infrastructure, what part of the city is least accessible by public transportation?
Given layers of lakes and rivers, what is the name of the water body closest to each location in the U.S.?
Given a layer of household income, where in the U.S. is the variation of income in the surrounding 50 miles the greatest?
build_multivariable_grid的结果也可用于预测和分类工作流程。该任务允许您一步计算来自许多不同数据源的信息并将其编译到一个空间连续的图层中。然后可以将此图层与 Enrich From Multi-Variable Grid 任务一起使用,以使用您计算的变量快速丰富点要素,从而减少从点数据构建预测和分类模型所需的工作量。Parameter
Description
input_layers
所需的图层列表。将在分析中使用的输入层列表。请参阅特征输入。
variable_calculations
所需的字典列表。包含对象的字典,这些对象说明将为
input_layers中的每一层计算的变量。variable_calculations = [ { "layer":<index>, "variables":[ { "type":"DistanceToNearest", "outFieldName":"<output field name>", "searchDistance":<number>, "searchDistanceUnit":"<unit>", "filter":"<filter>" }, { "type":"AttributeOfNearest", "outFieldName":"<output field name>", "attributeField":"<field name>", "searchDistance":<number>, "searchDistanceUnit":"<unit>", "filter":"<filter>" }, { "type":"AttributeSummaryOfRelated", "outFieldName":"<output field name>", "statisticType":"<statistic type>", "statisticField":"<field name>", "searchDistance":<number>, "searchDistanceUnit":"<unit>", "filter":"<filter>" }, ] }, ]上述片段的说明:
layeris the index of the layer ininput_layersthat will be used to calculate the specified variables.variablesis an array of dict objects that describe the variables you want to include in the result layer. The array must contain at least one variable for each layer.typecan be one of the following variable types:DistanceToNearest
AttributeOfNearest
AttributeSummaryOfRelated
Each type must be configured with a unique set of parameters:
outFieldNameis the name of the field that will be created in the result layer to store a variable. This is required.searchDistanceis a number andsearchDistanceUnitis a linear unit.- For:
DistanceToNearestandAttributeOfNearest- both are required to define the maximum distance that the tool will search from the center of each bin to find a feature in the layer. If no feature is within the distance, null is returned.AttributeSummaryOfRelated- , they are optional to define the radius of a circular neighborhood surrounding each bin. All features that intersect this neighborhood will be used to calculatestatisticType. If a distance is not defined, only features that intersect a bin will be used to calculatestatisticType.
attributeFieldis required byAttributeOfNearestand is the name of a field ` in the input layer. The value of this field in the closest feature to each bin will be included in the result layer.statisticFieldis required byAttributeSummaryOfRelatedand is the name of a field in the input layer. This field’s values will be used to calculatestatisticType.statisticTypeis required byAttributeSummaryOfRelatedand is one of the followingwhen
statisticFieldis a numeric field:Count- Totals the number of features near or intersecting each bin.Sum- Adds the total value of all features near or intersecting each bin.Mean- Calculates the average of all features near or intersecting each bin.Min- Finds the smallest value of all features near or intersecting each bin.Max- Finds the largest value of all features near or intersecting each bin.Range- Finds the difference between Min and Max.Stddev- Finds the standard deviation of all features near or intersecting each bin.Var- Finds the variance of all features near or intersecting each bin.
when
statisticFieldis a string field:Count- Totals the number of strings for all features near or intersecting each bin.Any- Returns a sample string of all features near or intersecting each bin.
filteris optional for all variable types and is formatted as described in the Feature Input topic.
bin_size
所需浮点数。输出多边形图层中
bin_type类型的 bin 的距离。variable_calculations将在每个 bin 的中心计算。生成 bin 时,if
bin_typeisSquare- the number and units specified determine the height and length of the square.if
bin_typeisHexagon0 the number and units specified determine the distance between parallel sides.
bin_unit
可选字符串。将用于计算
variable_calculations的 bin 的距离单位。选择清单:
FeetYardMilesMetersKilometersNauticalMiles
bin_type
可选字符串。将用于生成结果网格的 bin 类型。 Bin 选项如下:
选择清单:
HexagonSquare
注意:使用
Square或Hexagonbin 进行分析需要投影坐标系。将图层聚合到 bin 中时,输入图层或处理范围 (processSR) 必须具有投影坐标系。如果运行分析时未指定投影坐标系,则将使用世界圆柱等积 (WKID 54034) 投影。在 10.7 或更高版本中,如果运行分析时未指定投影坐标系,将根据数据范围选取投影。
output_name
可选字符串。该任务将创建结果的要素服务。您定义服务的名称。
context
可选字符串。 context 参数包含影响任务执行的其他设置。对于此任务,有四个设置:
extent- a bounding box that defines the analysis area. Only those features that intersect the bounding box will be analyzed.processSRThe features will be projected into this coordinate system for analysis.outSR- the features will be projected into this coordinate system after the analysis to be saved. The output spatial reference for the spatiotemporal big data store is always WGS84.dataStore- results will be saved to the specified data store. For ArcGIS Enterprise, the default is the spatiotemporal big data store.
future
可选布尔值。如果是
True,将返回一个 future 对象,并且进程不会等待任务完成。默认为False,表示等待结果。例子:
# Usage Example: To create multivariable grid by summarizing information such as distance to nearest

variables = [ { "layer":0,
                "variables":[
                    { "type":"DistanceToNearest",
                      "outFieldName":"road",
                      "searchDistance":10,
                      "searchDistanceUnit":"Kilometers"
                    }
                ]
              },
              { "layer":1,
              "variables":[
                  { "type":"AttributeSummaryOfRelated",
                    "outFieldName":"MeanPopAge",
                    "statisticType":"Mean",
                    "statisticField":"Age",
                    "searchDistance":50,
                    "searchDistanceUnit":"Kilometers"
                  }
              ]
              }
            ]
grid = build_multivariable_grid(input_layers=[lyr0, lyr1],
                                variable_calculations=variables,
                                bin_size=100,
                                bin_unit='Meters',
                                bin_type='Square',
                                output_name="multi_variable_grid")
相关用法
- Python ArcGIS build_multidimensional_transpose用法及代码示例
- Python ArcGIS build_overview用法及代码示例
- Python ArcGIS build_footprints用法及代码示例
- Python ArcGIS buffer用法及代码示例
- Python ArcGIS bitwise_not用法及代码示例
- Python ArcGIS bitwise_left_shift用法及代码示例
- Python ArcGIS bitwise_xor用法及代码示例
- Python ArcGIS bitwise_right_shift用法及代码示例
- Python ArcGIS boolean_or用法及代码示例
- Python ArcGIS band_arithmetic用法及代码示例
- Python ArcGIS boundary_clean用法及代码示例
- Python ArcGIS boolean_not用法及代码示例
- Python ArcGIS bitwise_or用法及代码示例
- Python ArcGIS batch_geocode用法及代码示例
- Python ArcGIS boolean_and用法及代码示例
- Python ArcGIS boolean_xor用法及代码示例
- Python ArcGIS bitwise_and用法及代码示例
- Python ArcGIS power用法及代码示例
- Python ArcGIS APIKeyManager.get用法及代码示例
- Python ArcGIS KnowledgeGraph.named_object_type_delete用法及代码示例
- Python ArcGIS ContentManager.unshare_items用法及代码示例
- Python ArcGIS ImageryLayer.thumbnail用法及代码示例
- Python ArcGIS FormFieldElement用法及代码示例
- Python ArcGIS Geometry.true_centroid用法及代码示例
- Python ArcGIS Site.delete用法及代码示例
注:本文由纯净天空筛选整理自arcgis.com大神的英文原创作品 arcgis.geoanalytics.summarize_data.build_multivariable_grid。非经特殊声明,原始代码版权归原作者所有,本译文未经允许或授权,请勿转载或复制。