Python的Plotly库对于数据可视化和简单,轻松地理解数据非常有用。
figure_factory.create_candlestick
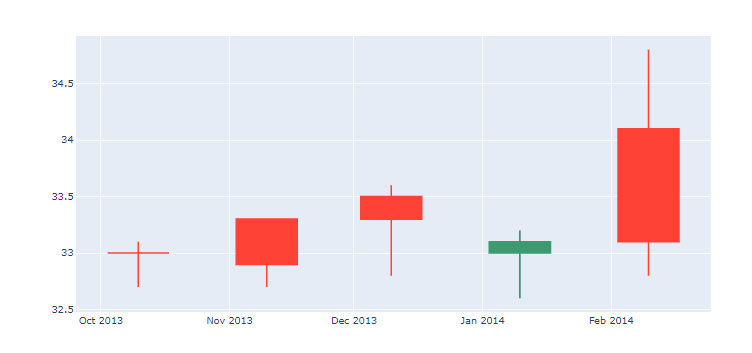
烛台图表是一种金融图表样式,描述了给定x坐标(最可能的时间)的o。框代表开盘价和收盘价之间的价差,而线代表低值和高值之间的价差。
用法:plotly.figure_factory.create_candlestick(open, high, low, close, dates=None, direction=’both’, **kwargs)
参数
open:它用于开价
high:它用于高价值
low:它用于低值
close:它用于关闭值
dates:它用于日期时间对象列表。默认值:无
direction:它可以用于增加和减少。当方向为‘increasing’时,返回的图形由收盘价大于相应开盘价的所有烛线组成;当方向为‘decreasing’时,返回的图形由收盘值小于或等于交易价的所有烛形线组成相应的开盘价。当方向为‘both’时,返回增加和减少烛台。默认值:‘both’
kwargs-描述了有关ohlc散布轨迹的其他属性,例如颜色或图例名称。有关有效kwarg的更多信息,请致电help(plotly.graph_objects.Scatter)
例子1:与日期时间对象
Python3
import plotly.graph_objects as go
from datetime import datetime

open_data = [33.0, 33.3, 33.5, 33.0, 34.1]
high_data = [33.1, 33.3, 33.6, 33.2, 34.8]
low_data = [32.7, 32.7, 32.8, 32.6, 32.8]
close_data = [33.0, 32.9, 33.3, 33.1, 33.1]
dates = [datetime(year=2013, month=10, day=10),
         datetime(year=2013, month=11, day=10),
         datetime(year=2013, month=12, day=10),
         datetime(year=2014, month=1, day=10),
         datetime(year=2014, month=2, day=10)]

fig = go.Figure(data=[go.Candlestick(x=dates,
                       open=open_data, high=high_data,
                       low=low_data, close=close_data)])

fig.show()
输出:

范例2:带有日期时间对象的烛台图
Python3
from plotly.figure_factory import create_candlestick
from datetime import datetime
# Add data
open_data = [33.0, 33.3, 33.5, 33.0, 34.1]
high_data = [33.1, 33.3, 33.6, 33.2, 34.8]
low_data = [32.7, 32.7, 32.8, 32.6, 32.8]
close_data = [33.0, 32.9, 33.3, 33.1, 33.1]
dates = [datetime(year=2013, month=10, day=10),
         datetime(year=2013, month=11, day=10),
         datetime(year=2013, month=12, day=10),
         datetime(year=2014, month=1, day=10),
         datetime(year=2014, month=2, day=10)]
# Create ohlc
fig = create_candlestick(open_data, high_data,
    low_data, close_data, dates=dates)
fig.show()
输出:
注:本文由纯净天空筛选整理自deepanshumehra1410大神的英文原创作品 plotly.figure_factory.create_candlestick() function in Python。非经特殊声明,原始代码版权归原作者所有,本译文未经允许或授权,请勿转载或复制。