Python的Plotly库对于数据可视化和简单,轻松地理解数据非常有用。
figure_factory.create_bullet
此方法用于创建项目符号图。此函数可以同时使用数据帧或字典序列。
用法:plotly.figure_factory.create_bullet(data, markers=None, measures=None, ranges=None, subtitles=None, titles=None, orientation=’h’, **layout_options)
参数:
数据:字典或 Pandas DataFrame的列表/元组。
标记:每个子图中标记的列名或字典键。
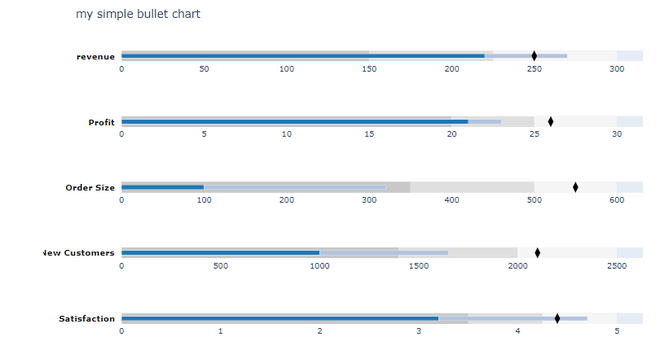
度量:此条通常表示性能的量化度量,通常是两个值[a,b]的列表,默认情况下是每个子图的前景中的蓝色条。
范围:此参数通常是一个3项列表[不好,可以,很好]。它们对应于每个图表背景中的灰色条。
字幕:每个子图图表的字幕的列名或字典键。
title((str))-每个子图图表的主标签的列名或字典键。
范例1:
Python3
import plotly.figure_factory as ff


data = [
  {"label":"revenue",
   "sublabel":"us$, in thousands",
   "range":[150, 225, 300],
   "performance":[220,270],
   "point":[250]},

  {"label":"Profit",
   "sublabel":"%",
   "range":[20, 25, 30],
   "performance":[21, 23],
   "point":[26]},

  {"label":"Order Size",
   "sublabel":"US$, average",
   "range":[350, 500, 600],
   "performance":[100,320],
   "point":[550]},

  {"label":"New Customers",
   "sublabel":"count",
   "range":[1400, 2000, 2500],
   "performance":[1000, 1650],
   "point":[2100]},

  {"label":"Satisfaction",
   "sublabel":"out of 5",
   "range":[3.5, 4.25, 5],
   "performance":[3.2, 4.7],
   "point":[4.4]}
]

fig = ff.create_bullet(
    data, titles='label',
    subtitles='sublabel',
    markers='point',
    measures='performance',
    ranges='range',
    orientation='h',
    title='my simple bullet chart'
)

fig.show()
输出:

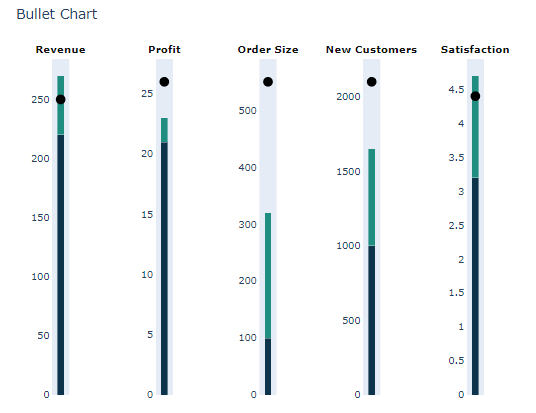
范例2:将 DataFrame 与颜色一起使用
Python3
import plotly.figure_factory as ff
import pandas as pd


data = [
    {"title":"Revenue",
     "subtitle":"US$, in thousands",
     "ranges":[150, 225, 300],
     "measures":[220, 270],
     "markers":[250]},

    {"title":"Profit",
     "subtitle":"%",
     "ranges":[20, 25, 30],
     "measures":[21, 23],
     "markers":[26]},

    {"title":"Order Size",
     "subtitle":"US$, average",
     "ranges":[350, 500, 600],
     "measures":[100, 320],
     "markers":[550]},

    {"title":"New Customers",
     "subtitle":"count",
     "ranges":[1400, 2000, 2500],
     "measures":[1000, 1650],
     "markers":[2100]},

    {"title":"Satisfaction",
     "subtitle":"out of 5",
     "ranges":[3.5, 4.25, 5],
     "measures":[3.2, 4.7],
     "markers":[4.4]}
]

fig = ff.create_bullet(
    data, titles='title',
    markers='markers',
    measures='measures',
    orientation='v',
    measure_colors=['rgb(14, 52, 75)', 'rgb(31, 141, 127)'],
    scatter_options={'marker':{'symbol':'circle'}},
  width=700)

fig.show()
输出:

相关用法
注:本文由纯净天空筛选整理自deepanshumehra1410大神的英文原创作品 plotly.figure_factory.create_bullet() in Python。非经特殊声明,原始代码版权归原作者所有,本译文未经允许或授权,请勿转载或复制。
