Matplotlib是Python中的一个库,它是数字的-NumPy库的数学扩展。 Pyplot是Matplotlib模块的基于状态的接口,该模块提供了MATLAB-like接口。
Matplotlib.pyplot.tricontourf()
matplotlib库的pyplot模块中的tricontourf()函数用于在非结构化三角形网格上绘制轮廓。
用法: matplotlib.pyplot.tricontourf(\*args, \*\*kwargs)
参数:此方法接受下面描述的以下参数:
- x, y:这些参数是要绘制的数据的x和y坐标。
- triangulation:此参数是matplotlib.tri.Triangulation对象。
- Z:此参数是轮廓值的数组,三角测量中每个点一个。
- **kwargs:此参数是文本属性,用于控制标签的外观。
其余所有args和kwargs与matplotlib.pyplot.plot()相同。
返回值:这将返回包含以下内容的2 Line2D的列表:
- 为三角形边绘制的线。
- 为三角形节点绘制的标记
注意:tricontourf-only关键字参数是抗锯齿的,它是布尔启用抗锯齿,用于非结构化三角形网格的轮廓中。
以下示例说明了matplotlib.pyplot中的matplotlib.pyplot.tricontourf()函数:
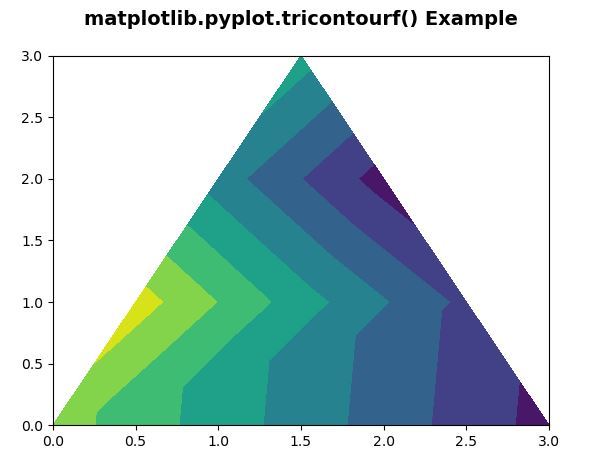
范例1:
Python3
#Implementation of matplotlib function
import matplotlib.pyplot as plt
import matplotlib.tri as mtri
import numpy as np


# Create triangulation.
x = np.asarray([0, 1, 0, 3, 0.5, 1.5,
                2.5, 1, 2, 1.5])
y = np.asarray([0, 0, 0, 0, 1.0, 1.0,
                1.0, 2, 2, 3.0])

triangles = [[0, 1, 4], [1, 5, 4], [2, 6, 5],
             [4, 5, 7], [5, 6, 8], [5, 8, 7],
             [7, 8, 9], [1, 2, 5], [2, 3, 6]]

triang = mtri.Triangulation(x, y, triangles)
z = np.cos(2.5 * x*x) + np.sin(2.5 * x*x)

t = plt.tricontourf(triang, z)

plt.title('matplotlib.pyplot.tricontourf() Example\n',
          fontsize=14, fontweight='bold')

plt.show()
输出:
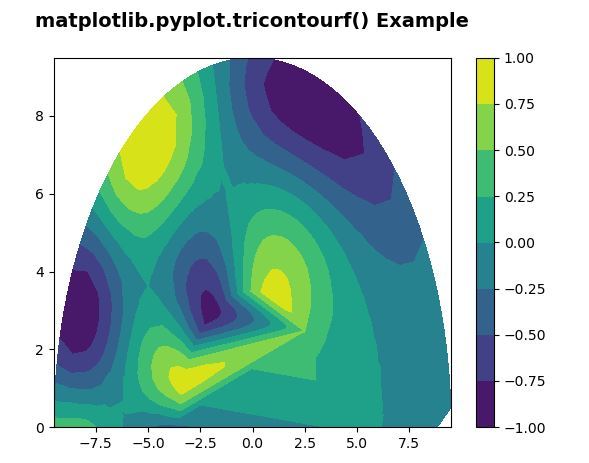
范例2:
Python3
#Implementation of matplotlib function
import matplotlib.pyplot as plt
import matplotlib.tri as tri
import numpy as np


n_angles = 60
n_radii = 10
min_radius = 0.35
radii = np.linspace(min_radius, 0.95, n_radii)

angles = np.linspace(0, np.pi, n_angles, endpoint = False)
angles = np.repeat(angles[..., np.newaxis], n_radii, axis = 1)
angles[:, 1::2] += np.pi / n_angles

x = (10 * radii * np.cos(angles)).flatten()
y = (10 * radii * np.sin(angles)).flatten()
z = (np.cos(4*(radii)**2) * np.sin((angles)**2)).flatten()

triang = tri.Triangulation(x, y)

triang.set_mask(np.hypot(x[triang.triangles].mean(axis = 1),
                         y[triang.triangles].mean(axis = 1))
                < min_radius)

tcf = plt.tricontourf(triang, z)

plt.colorbar(tcf)
plt.title('matplotlib.pyplot.tricontourf() Example\n',
          fontsize=14, fontweight='bold')

plt.show()
输出:
相关用法
注:本文由纯净天空筛选整理自SHUBHAMSINGH10大神的英文原创作品 Matplotlib.pyplot.tricontourf() in Python。非经特殊声明,原始代码版权归原作者所有,本译文未经允许或授权,请勿转载或复制。