Matplotlib是Python编程语言的绘图库,其数值数学模块为NumPy。 matplotlib.pyplot是使matplotlib像MATLAB工具一样工作的命令样式函数的集合。每个pyplot函数都会对图形进行某些更改:例如,创建图形,在图形中创建绘图区域,在绘图区域中绘制一些线条或使用标签装饰绘图等。
注意:有关更多信息,请参阅Matplotlib中的Pyplot。
Matplotlib.pyplot.thetagrids()
在极坐标图中设置网格线的theta位置。如果未传递任何参数,则返回一个元组(线,标签),其中线是径向网格线的数组(Line2D实例),而标签是刻度标签的数组(文本实例):
用法: lines, labels = thetagrids(angles, labels=None, fmt=’%d’, frac = 1.5)
参数:
- Angles:
将角度设置为theta网格的位置(这些网格线沿theta尺寸相等)
- labels:如果不是None,则为len(angles)或在每个角度使用的标签字符串列表。如果标签为None,则标签为
fmt%angle。 - frac:它是极坐标半径在标签位置的分数(1是边)。例如1.25在轴外,而0.75在轴内。
返回类型:返回值是元组列表(行,标签)
注意:line是Line2D实例,标签是Text实例。
例:
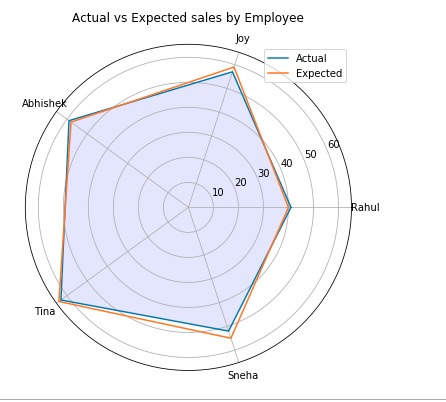
import matplotlib.pyplot as plt
import numpy as np

employee = ["Rahul", "Joy", "Abhishek",
            "Tina", "Sneha"]

actual = [41, 57, 59, 63, 52, 41]
expected = [40, 59, 58, 64, 55, 40]

# Initialing the spiderplot by
# setting figure size and polar
# projection
plt.figure(figsize =(10, 6))
plt.subplot(polar = True)

theta = np.linspace(0, 2 * np.pi, len(actual))

# Arranging the grid into number
# of sales into equal parts in
# degrees
lines, labels = plt.thetagrids(range(0, 360, int(360/len(employee))),
                                                         (employee))

# Plot actual sales graph
plt.plot(theta, actual)
plt.fill(theta, actual, 'b', alpha = 0.1)

# Plot expected sales graph
plt.plot(theta, expected)

# Add legend and title for the plot
plt.legend(labels =('Actual', 'Expected'),
           loc = 1)
plt.title("Actual vs Expected sales by Employee")

# Dsiplay the plot on the screen
plt.show()
输出:
相关用法
注:本文由纯净天空筛选整理自SahkalPoddar大神的英文原创作品 Matplotlib.pyplot.thetagrids() in Python。非经特殊声明,原始代码版权归原作者所有,本译文未经允许或授权,请勿转载或复制。