Matplotlib是Python中的一个库,它是数字的-NumPy库的数学扩展。 Pyplot是Matplotlib模块的基于状态的接口,该模块提供了MATLAB-like接口。
示例代码-
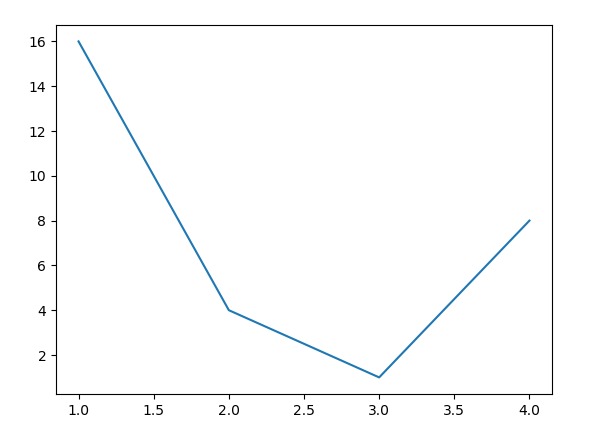
# sample code
import matplotlib.pyplot as plt

plt.plot([1, 2, 3, 4], [16, 4, 1, 8])
plt.show()
输出:
matplotlib.pyplot.show()函数
matplotlib库的pyplot模块中的show()函数用于显示所有图形。
用法:
matplotlib.pyplot.show(*args, **kw)
参数:此方法仅接受一个参数,下面将对其进行讨论:
- block:此参数用于覆盖上述阻止行为。
返回值:此方法不返回任何值。
以下示例说明了matplotlib.pyplot中的matplotlib.pyplot.show()函数:
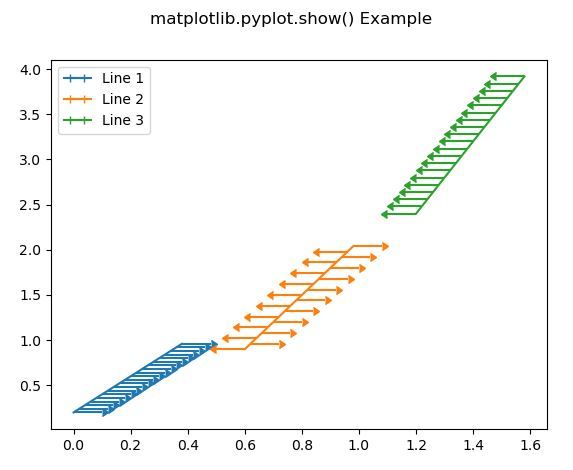
范例1:
# Implementation of matplotlib function
import matplotlib.pyplot as plt
import numpy as np

fig = plt.figure()
x = np.arange(20) / 50
y = (x + 0.1)*2

val1 = [True, False] * 10
val2 = [False, True] * 10

plt.errorbar(x, y,
             xerr = 0.1,
             xlolims = True,
             label ='Line 1')

y = (x + 0.3)*3

plt.errorbar(x + 0.6, y,
             xerr = 0.1,
             xuplims = val1,
             xlolims = val2,
             label ='Line 2')

y = (x + 0.6)*4
plt.errorbar(x + 1.2, y,
             xerr = 0.1,
             xuplims = True,
             label ='Line 3')

plt.legend()

fig.suptitle('matplotlib.pyplot.show() Example')
plt.show()
输出:
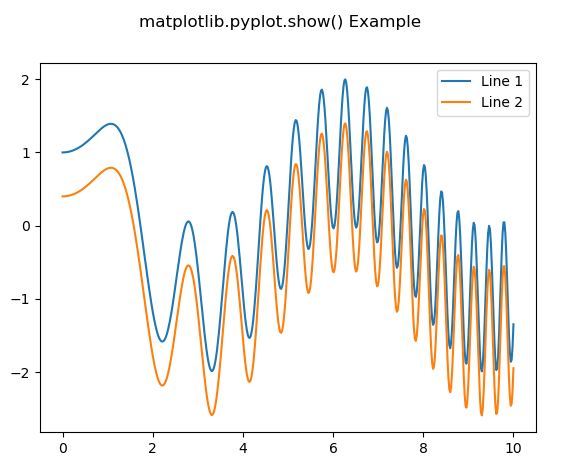
范例2:
# Implementation of matplotlib function
import numpy as np
import matplotlib.pyplot as plt

x = np.linspace(0, 10, 500)
y = np.sin(x**2)+np.cos(x)

fig, ax = plt.subplots()

ax.plot(x, y, label ='Line 1')

ax.plot(x, y - 0.6, label ='Line 2')

ax.legend()

fig.suptitle('matplotlib.pyplot.show() Example')
plt.show()
输出:
注:本文由纯净天空筛选整理自 Matplotlib.pyplot.show() in Python。非经特殊声明,原始代码版权归原作者所有,本译文未经允许或授权,请勿转载或复制。