Matplotlib是Python中的一个库,它是数字的-NumPy库的数学扩展。 Pyplot是Matplotlib模块的基于状态的接口,该模块提供了MATLAB-like接口。
matplotlib.pyplot.pink()函数:
matplotlib库的pyplot模块中的pink()函数用于将颜色映射设置为“pink”。
用法:
matplotlib.pyplot.pink()
参数:此方法不接受任何参数。
返回值:此方法不返回任何值。
以下示例说明了matplotlib.pyplot中的matplotlib.pyplot.pink()函数:
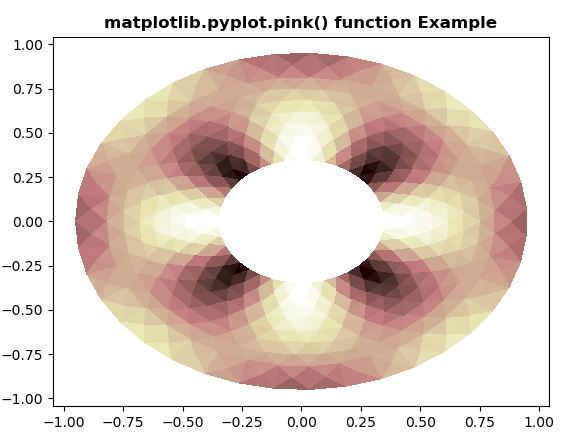
范例1:
# Implementation of matplotlib function
import matplotlib.pyplot as plt
import matplotlib.tri as tri
import numpy as np

ang = 40
rad = 10
radm = 0.35
radii = np.linspace(radm, 0.95, rad)

angles = np.linspace(0, 4 * np.pi, ang)
angles = np.repeat(angles[..., np.newaxis], rad, axis = 1)
angles[:, 1::2] += np.pi / ang

x = (radii * np.cos(angles)).flatten()
y = (radii * np.sin(angles)).flatten()
z = (np.sin(4 * radii) * np.cos(4 * angles)).flatten()

triang = tri.Triangulation(x, y)
triang.set_mask(np.hypot(x[triang.triangles].mean(axis = 1),
                         y[triang.triangles].mean(axis = 1))
                < radm)

tpc = plt.tripcolor(triang, z, shading ='flat')
plt.pink()
plt.title('matplotlib.pyplot.pink() function Example', fontweight ="bold")
plt.show()
输出:
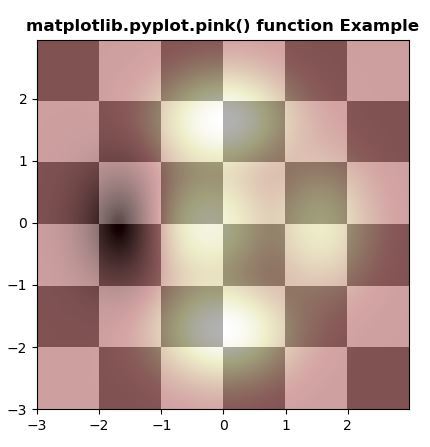
范例2:
# Implementation of matplotlib function
import matplotlib.pyplot as plt
import numpy as np
from matplotlib.colors import LogNorm

dx, dy = 0.015, 0.05
x = np.arange(-3.0, 3.0, dx)
y = np.arange(-3.0, 3.0, dy)
X, Y = np.meshgrid(x, y)

extent = np.min(x), np.max(x), np.min(y), np.max(y)


Z1 = np.add.outer(range(6), range(6)) % 2
plt.imshow(Z1, cmap ="binary_r", interpolation ='nearest',
                 extent = extent, alpha = 1)

def geeks(x, y):
    return (1 - x / 2 + x**5 + y**6) * np.exp(-(x**2 + y**2))

Z2 = geeks(X, Y)

plt.imshow(Z2, alpha = 0.7, interpolation ='bilinear',
                 extent = extent)
plt.pink()
plt.title('matplotlib.pyplot.pink() function Example', fontweight ="bold")
plt.show()
输出:
相关用法
注:本文由纯净天空筛选整理自SHUBHAMSINGH10大神的英文原创作品 matplotlib.pyplot.pink() in Python。非经特殊声明,原始代码版权归原作者所有,本译文未经允许或授权,请勿转载或复制。