Matplotlib是Python中广泛使用的用于绘制各种图形的库,因为它提供了非常有效的方法,也为复杂图提供了易于理解的方法。 matplotlib.pyplot是一个绘图库,用于Python编程语言中的2D图形。 Pyplot是使matplotlib像MATLAB一样工作的命令样式函数的集合。
autoscale()函数
matplotlib.pyplot.autoscale()是一种用于简单轴视图自动缩放的方法。它将打开或关闭自动缩放,然后,如果打开了任一轴的自动缩放,则会在指定的一个或多个轴上执行自动缩放。
用法: matplotlib.pyplot.autoscale(enable=True, axis=’both’, tight=None)
参数:
enable是一个布尔值参数,如果将其设置为True,则自动缩放函数打开,否则auto-scaling关闭。它是一个可选参数。如果未指定,则默认值为‘true’。
axis是另一个可选参数,用于指定要在其上运行的轴。通常可以是‘both’,‘x’或‘y’。如果未指定,则默认值为‘both’。
tight采用布尔参数,如果为True,则首先将边距设置为零。然后,此参数将转发到autoscale_view(无论其值如何)。这也是自动缩放方法的可选参数。
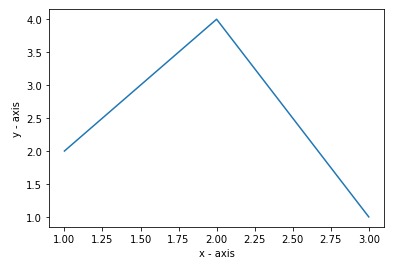
范例1:
# importing the required module
import matplotlib.pyplot as plt

# x axis values
x = [1,2,3]

# corresponding y axis values
y = [2,4,1]

# plotting the points
plt.plot(x, y)

# naming the x axis
plt.xlabel('x - axis')

# naming the y axis
plt.ylabel('y - axis')

plt.autoscale()
plt.show()
输出:

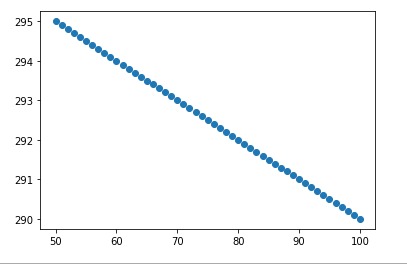
范例2:
import numpy as np
import matplotlib.pyplot as plt


x, y = np.arange(0, 101, 1), 300 - 0.1 * np.arange(0, 101, 1)
mask = (x >= 50) & (x <= 100)

fig, ax = plt.subplots()
ax.scatter(x[mask], y[mask])

plt.autoscale()
plt.show()
输出:

相关用法
注:本文由纯净天空筛选整理自rutujakawade24大神的英文原创作品 Matplotlib.pyplot.autoscale() in Python。非经特殊声明,原始代码版权归原作者所有,本译文未经允许或授权,请勿转载或复制。
