Matplotlib是Python中的一个库,它是数字的-NumPy库的数学扩展。 Figure模块提供了顶层Artist,即Figure,其中包含所有绘图元素。此模块用于控制所有图元的子图和顶层容器的默认间距。
matplotlib.figure.Figure.add_gridspec()函数
matplotlib库的add_gridspec()方法图形模块用于获取以该图形为父级的GridSpec。
用法: add_gridspec(self, nrows, ncols, **kwargs)
参数:这接受以下描述的以下参数:
- nrows:此参数是网格中的行数。
- ncols:此参数是网格中的数字或列。
返回值:此方法返回GridSpec。
以下示例说明了matplotlib.figure中的matplotlib.figure.Figure.add_gridspec()函数:
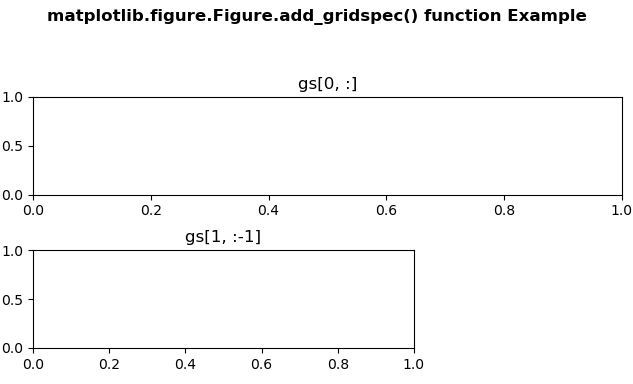
范例1:
# Implementation of matplotlib function
import matplotlib
import matplotlib.pyplot as plt
import matplotlib.gridspec as gridspec


fig = plt.figure(constrained_layout = True)
gs = fig.add_gridspec(3, 3)
ax = fig.add_subplot(gs[0,:])
ax.set_title('gs[0,:]')
ax2 = fig.add_subplot(gs[1,:-1])
ax2.set_title('gs[1,:-1]')


fig.suptitle('matplotlib.figure.Figure.add_gridspec() \
function Example\n\n', fontweight ="bold")

plt.show()
输出:
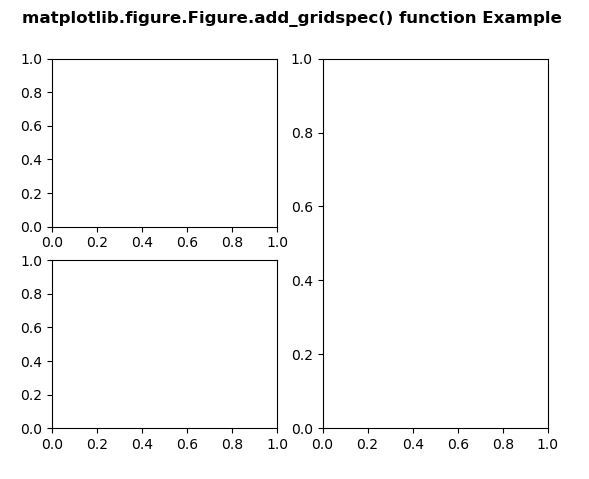
范例2:
# Implementation of matplotlib function
import matplotlib
import matplotlib.pyplot as plt
import matplotlib.gridspec as gridspec


fig = plt.figure()
gs = fig.add_gridspec(2, 2)
ax1 = fig.add_subplot(gs[0, 0])
ax2 = fig.add_subplot(gs[1, 0])
ax3 = fig.add_subplot(gs[:, 1])


fig.suptitle('matplotlib.figure.Figure.add_gridspec()\
 function Example\n\n', fontweight ="bold")

plt.show()
输出:
相关用法
注:本文由纯净天空筛选整理自SHUBHAMSINGH10大神的英文原创作品 Matplotlib.figure.Figure.add_gridspec() in Python。非经特殊声明,原始代码版权归原作者所有,本译文未经允许或授权,请勿转载或复制。