Matplotlib是Python中的一个库,它是数字的-NumPy库的数学扩展。轴类包含大多数图形元素:Axis,Tick,Line2D,Text,Polygon等,并设置坐标系。 Axes实例通过callbacks属性支持回调。
matplotlib.axes.Axes.set_ybound()函数
matplotlib库的axiss模块中的Axes.set_ybound()函数用于设置y轴的上下数值边界。
用法: Axes.set_ybound(self, lower=None, upper=None)
参数:此方法接受以下参数。
- lower, upper:这些参数是上下限。如果为None,则不修改相应的轴边界。
返回值:此方法返回以下内容
- lower, upper:这将返回新的y上下边界。
注意:可以在各种条件下代替set_ylim使用此函数。
以下示例说明了matplotlib.axes中的matplotlib.axes.Axes.set_ybound()函数:
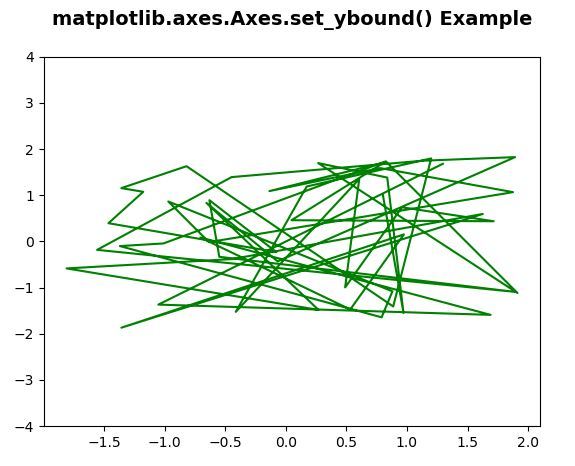
范例1:
# Implementation of matplotlib function
from matplotlib.widgets import Cursor
import numpy as np
import matplotlib.pyplot as plt


np.random.seed(19680801)

fig, ax = plt.subplots()

x, y = 4*(np.random.rand(2, 50) - .5)
ax.plot(x, y, 'g')
ax.set_ybound(-4, 4)

ax.set_title('matplotlib.axes.Axes.set_ybound() Example\n',
             fontsize = 14, fontweight ='bold')
plt.show()
输出:
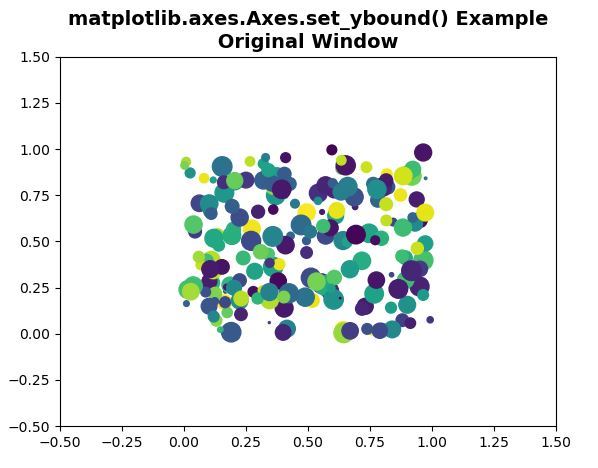
范例2:
# Implementation of matplotlib function
import matplotlib.pyplot as plt
import numpy as np
fig1, ax1 = plt.subplots()
fig2, ax2 = plt.subplots()
ax1.set(xlim =(-0.5, 1.5), ylim =(-0.5, 1.5),
autoscale_on = False)
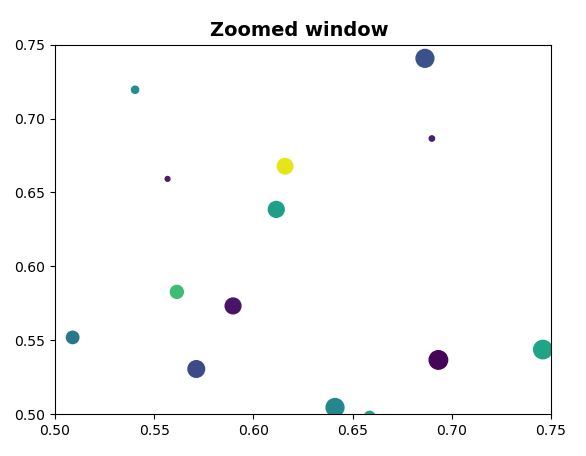
ax2.set(xlim =(0.5, 0.75), ylim =(0.5, 0.75),
autoscale_on = False)
x, y, s, c = np.random.rand(4, 200)
s *= 200
ax1.scatter(x, y, s, c)
ax2.scatter(x, y, s, c)
def GFG(event):
if event.button != 1:
return
x, y = event.xdata, event.ydata
ax2.set_xbound(x - 0.1, x + 0.1)
ax2.set_ybound(y - 0.2, y + 0.2)
fig2.canvas.draw()
fig1.canvas.mpl_connect('button_press_event', GFG)
ax1.set_title('matplotlib.axes.Axes.set_ybound()\
Example\n Original Window ',
fontsize = 14, fontweight ='bold')
ax2.set_title('Zoomed window ',
fontsize = 14, fontweight ='bold')
plt.show()输出:
相关用法
注:本文由纯净天空筛选整理自SHUBHAMSINGH10大神的英文原创作品 Matplotlib.axes.Axes.set_ybound() in Python。非经特殊声明,原始代码版权归原作者所有,本译文未经允许或授权,请勿转载或复制。