Matplotlib是Python中的一个库,它是数字的-NumPy库的数学扩展。轴类包含大多数图形元素:Axis,Tick,Line2D,Text,Polygon等,并设置坐标系。 Axes实例通过callbacks属性支持回调。
matplotlib.axes.Axes.magnitude_spectrum()函数
matplotlib库的axiss模块中的Axes.magnitude_spectrum()函数用于绘制幅度谱。
用法: Axes.magnitude_spectrum(self, x, Fs=None, Fc=None, window=None, pad_to=None, sides=None, *, data=None, **kwargs)
参数:此方法接受以下描述的参数:
- x:此参数是数据序列。
- Fs:此参数是标量。默认值为2。
- window:此参数将数据段作为参数,并返回该段的窗口版本。其默认值为window_hanning()
- sides:此参数指定要返回光谱的哪一侧。它可以具有以下值:“默认”,“单面”和“双面”。
- pad_to:此参数包含填充数据段的整数值。
- Fc:此参数还包含一个整数值,用于抵消曲线图的x范围以反映频率范围。其默认值为0
返回值:这将返回以下内容:
- 光谱:这将返回以弧度为单位的角度光谱。
- 频率:这将返回与频谱中的元素相对应的频率。
- 线:这将返回此函数创建的行。
结果是(频谱,频率,线)
以下示例说明了matplotlib.axes中的matplotlib.axes.Axes.magnitude_spectrum()函数:
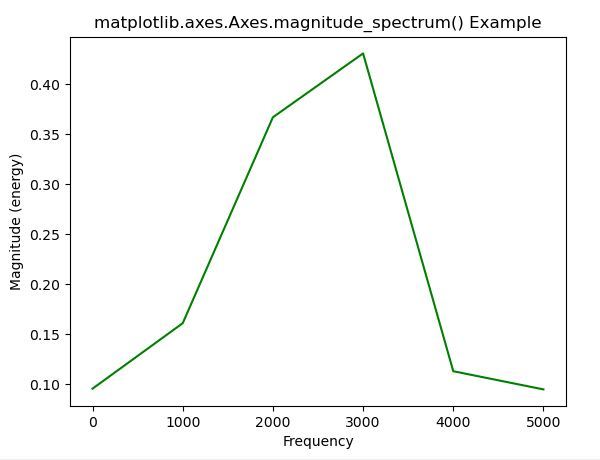
范例1:
# Implementation of matplotlib function
import matplotlib.pyplot as plt
import numpy as np
np.random.seed(10**5)

dt = 0.0001
Fs = 1 / dt
geeks = np.array([22.00, 61.90, 7.80,
                  24.40, 110.25, 20.05,
                  15.00, 22.80, 34.90,
                  57.30])

nse = np.random.randn(len(geeks))
r = np.exp(-geeks / 0.05)

s = 0.5 * np.sin(1.5 * np.pi * geeks) + nse

# plot magnitude_spectrum
fig, ax = plt.subplots()
ax.magnitude_spectrum(s, Fs = Fs,
                      color ="green")

ax.set_title('matplotlib.axes.Axes.magnitude_spectrum()\
Example')

plt.show()
输出:
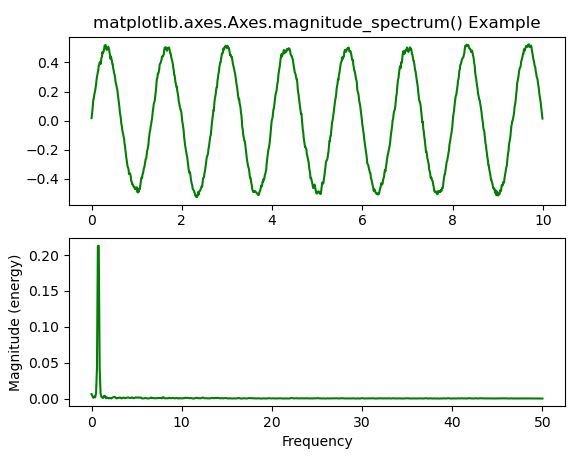
范例2:
# Implementation of matplotlib function
import matplotlib.pyplot as plt
import numpy as np
np.random.seed(0)

dt = 0.01
Fs = 1 / dt
t = np.arange(0, 10, dt)
res = np.random.randn(len(t))
r = np.exp(-t / 0.05)

cres = np.convolve(res, r)*dt
cres = cres[:len(t)]
s = 0.5 * np.sin(1.5 * np.pi * t) + cres

# plot simple spectrum
fig, (ax1, ax2) = plt.subplots(2, 1)
ax1.plot(t, s, color ="green")

# plot magnitude_spectrum
ax2.magnitude_spectrum(s, Fs = Fs,
                       color ="green")

ax1.set_title('matplotlib.axes.Axes.magnitude_spectrum()\
Example')

plt.show()
输出:
注:本文由纯净天空筛选整理自SHUBHAMSINGH10大神的英文原创作品 Matplotlib.axes.Axes.magnitude_spectrum() in Python。非经特殊声明,原始代码版权归原作者所有,本译文未经允许或授权,请勿转载或复制。