Matplotlib是Python中的一个库,它是数字的-NumPy库的数学扩展。轴类包含大多数图形元素:Axis,Tick,Line2D,Text,Polygon等,并设置坐标系。 Axes实例通过callbacks属性支持回调。
matplotlib.axes.Axes.arrow()函数
matplotlib库的axiss模块中的Axes.arrow()函数也用于向轴添加箭头。此函数用于从(x,y)到(x + dx,y + dy)绘制箭头
用法:
Axes.arrow(self, x, y, dx, dy, **kwargs)
参数:此方法接受以下描述的参数:
- x, y:这些参数是箭头基的x和y坐标。
- dx, dy:这些参数是箭头沿x和y方向的长度。
返回值:此方法返回作为创建的FancyArrow对象的箭头。
以下示例说明了matplotlib.axes中的matplotlib.axes.Axes.arrow()函数:
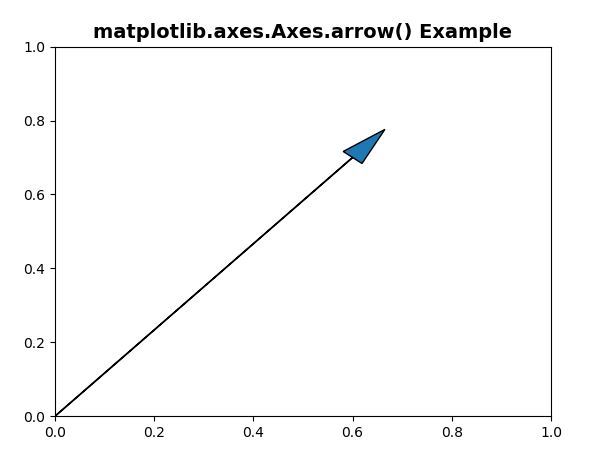
示例1:
# Implementation of matplotlib function
import matplotlib.pyplot as plt

ax = plt.axes()
ax.arrow(0, 0, 0.6, 0.7, head_width = 0.05,
         head_length = 0.1)

ax.set_title('matplotlib.axes.Axes.arrow() Example',
             fontsize = 14, fontweight ='bold')

plt.show()
输出:
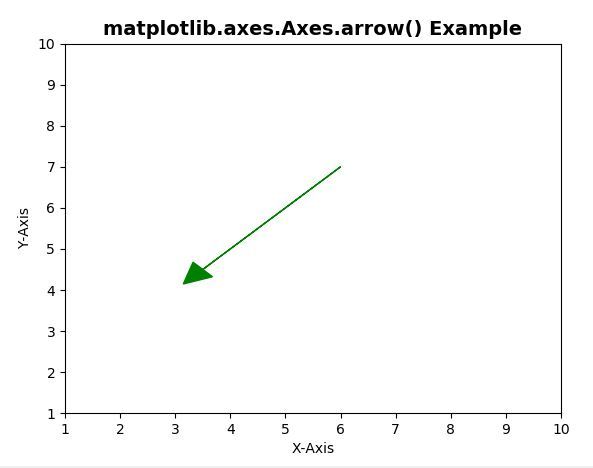
示例2:
# Implementation of matplotlib function
import matplotlib.pyplot as plt

ax = plt.axes()
ax.arrow(6, 7, -2.5, -2.5, head_width = 0.5,
         head_length = 0.5, fc ='g', ec ='g')
ax.set_title('matplotlib.axes.Axes.arrow() Example',
              fontsize = 14, fontweight ='bold')

ax.set(xlim =(1, 10), ylim =(1, 10))
ax.set_xlabel("X-Axis")
ax.set_ylabel("Y-Axis")

plt.show()
输出:
相关用法
注:本文由纯净天空筛选整理自SHUBHAMSINGH10大神的英文原创作品 Matplotlib.axes.Axes.arrow() in Python。非经特殊声明,原始代码版权归原作者所有,本译文未经允许或授权,请勿转载或复制。