JavaScript D3.js库使用HTML5,可缩放矢量图形和级联样式表为网页提供交互式数据可视化。 d3.js中的geoMtFlatPolarParabolic()函数用于绘制McBryde-Thomas flat-polar抛物线伪圆柱equal-area投影。
用法:
d3.geoMtFlatPolarParabolic()
参数:此方法不接受任何参数。
返回:此方法根据给定的JSON数据创建McBryde-Thomas flat-polar抛物线伪圆柱equal-area投影。
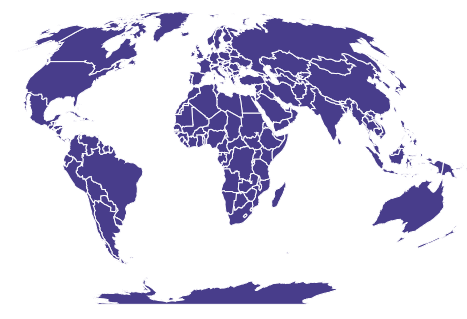
范例1:以下示例创建中心为(0,0)且不旋转的MtFlatPolarParabolic投影世界。
<!DOCTYPE html>
<html lang="en">
    <head>
        <meta charset="UTF-8" />
        <meta
            name="viewport"
            content="width=device-width,
                initial-scale=1.0"
        />
    </head>

    <body>
        <div style="width:700px; height:500px;">
            <center>
                <h3 style="color:black;"></h3>
            </center>

            <svg width="600" height="450"></svg>
        </div>
        <script src="https://d3js.org/d3.v4.js"></script>
        <script src=
                "https://d3js.org/d3-geo-projection.v2.min.js">
      </script>
        <script>
            var svg = d3.select("svg"),
                width = +svg.attr("width"),
                height = +svg.attr("height");

            // MtFlatPolarParabolic projection
            // Center(0, 0) with 0 rotation
            var gfg = d3
                .geoMtFlatPolarParabolic()
                .scale(width / 1.8 / Math.PI)
                .rotate([0, 0])
                .center([0, 0])
                .translate([width / 2, height / 2]);

            // Loading the json data
            // Used json file stored at
/*https://raw.githubusercontent.com/janasayantan
             /datageojson/master/world.json*/
            d3.json(
"https://raw.githubusercontent.com/janasayantan/datageojson/master/world.json",
              function (data) {
                // Drawing the map
                svg.append("g").selectAll(
                  "path").data(data.features).enter().append(
                  "path").attr("fill", "DarkSlateBlue").attr(
                  "d", d3.geoPath().projection(gfg)).style(
                  "stroke", "#ffff");
            });
        </script>
    </body>
</html>
输出:
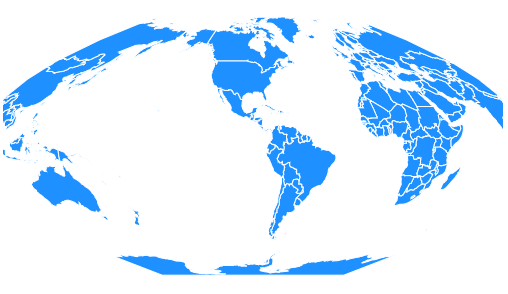
范例2:在以下示例中,我们将创建世界的MtFlatPolarParabolic投影,其中心位于(0,20),并且相对于Y轴旋转90度。
<!DOCTYPE html>
<html lang="en">
    <head>
        <meta charset="UTF-8" />
        <meta
            name="viewport"
            content="width=device-width,
                initial-scale=1.0"
        />
    </head>

    <body>
        <div style="width:700px; height:600px;">
            <center>
                <h3 style="color:black;"></h3>
            </center>

            <svg width="500" height="450"></svg>
        </div>
        <script src="https://d3js.org/d3.v4.js"></script>
        <script src=
             "https://d3js.org/d3-geo-projection.v2.min.js">
      </script>
        <script>
            var svg = d3.select("svg"),
                width = +svg.attr("width"),
                height = +svg.attr("height");

            // MtFlatPolarParabolic  projection
         // Center(0, 20) and 90 degree rotation w.r.t Y axis
            var gfg = d3
                .geoMtFlatPolarParabolic()
                .scale(width / 1.7 / Math.PI)
                .rotate([90, 0])
                .center([0, 20])
                .translate([width / 2, height / 2]);

            // Loading the json data
            // Used json file stored at
/*https://raw.githubusercontent.com/janasayantan
            /datageojson/master/world.json*/
            d3.json(
"https://raw.githubusercontent.com/janasayantan/datageojson/master/world.json",
              function (data) {
                // Draw the map
                svg.append("g").selectAll(
                  "path").data(data.features).enter().append(
                  "path").attr("fill", "DodgerBlue").attr(
                  "d", d3.geoPath().projection(gfg)).style(
                  "stroke", "#ffff");
            });
        </script>
    </body>
</html>
输出:
相关用法
- PHP imagecreatetruecolor()用法及代码示例
- p5.js year()用法及代码示例
- d3.js d3.utcTuesdays()用法及代码示例
- PHP ImagickDraw getTextAlignment()用法及代码示例
- PHP Ds\Sequence last()用法及代码示例
- PHP array_udiff_uassoc()用法及代码示例
- PHP geoip_continent_code_by_name()用法及代码示例
- d3.js d3.map.set()用法及代码示例
- PHP GmagickPixel setcolor()用法及代码示例
- PHP opendir()用法及代码示例
- PHP cal_to_jd()用法及代码示例
- d3.js d3.bisectLeft()用法及代码示例
- PHP stream_get_transports()用法及代码示例
- PHP Ds\Deque pop()用法及代码示例
注:本文由纯净天空筛选整理自jana_sayantan大神的英文原创作品 D3.js geoMtFlatPolarParabolic() Function。非经特殊声明,原始代码版权归原作者所有,本译文未经允许或授权,请勿转载或复制。