d3.js中的geoAiry()函数用于根据给定的geojson数据绘制艾里的minimum-error方位角投影。这是对由于Map投影最小化而导致的形状和面积误差的解决方案。
用法:
d3.geoAiry()
参数:此方法不接受任何参数。
返回值:此方法返回艾里的minimum-error方位角投影。
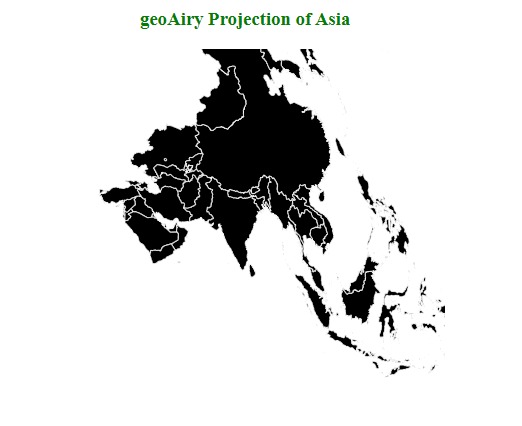
范例1:以下示例绘制了Airy的亚洲minimum-error方位角投影。
HTML
<!DOCTYPE html>
<html>

<head>
    <script src="https://d3js.org/d3.v4.min.js">
    </script>
    <script src=
"https://d3js.org/d3-geo-projection.v2.min.js">
    </script>
</head>

<body>
    <div style="width:1200px; height:1000px;">
        <center>
            <h3 style="color:green">
                geoAiry Projection of Asia
            </h3>
        </center>
        <svg width="800" height="500">
        </svg>
    </div>
    <svg width="400" height="300"></svg>
    <script>
        var svg = d3.select("svg"),
            width = +svg.attr("width"),
            height = +svg.attr("height");

        // geoAiry projection
        var gfg = d3.geoAiry()
            .scale(width / 1.5 / Math.PI)
            .translate([width / 2, height / 2]);

        // Loading the json data
        d3.json("https://raw.githubusercontent.com/" +
            "janasayantan/datageojson/master/" +
            "geoasia.json",
            function (data) {

                // Draw the map
                svg.append("g")
                    .selectAll("path")
                    .data(data.features)
                    .enter().append("path")
                    .attr("fill", "black")
                    .attr("d", d3.geoPath()
                        .projection(gfg)
                    )
                    .style("stroke", "#ffff")
            });
    </script>
</body>

</html>
输出:
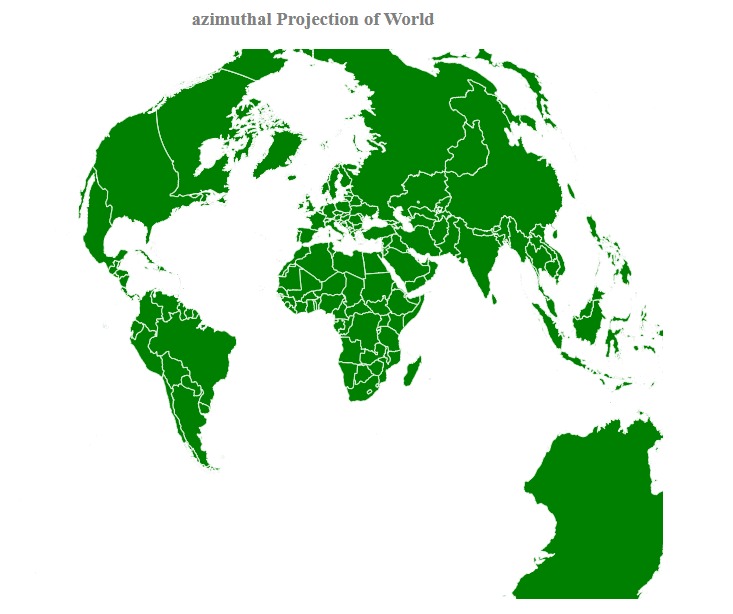
范例2:以下示例绘制了Airy的minimum-error世界方位角投影。
HTML
<!DOCTYPE html>
<html>

<head>
    <script src="https://d3js.org/d3.v4.js">
    </script>
    <script src=
"https://d3js.org/d3-geo-projection.v2.min.js">
    </script>
</head>

<body>
    <div style="width:700px; height:600px;">
        <center>
            <h3 style="color:grey">
                azimuthal Projection of World
            </h3>
        </center>
        <svg width="700" height="550">
        </svg>
    </div>
    <script>
        var svg = d3.select("svg"),
            width = +svg.attr("width"),
            height = +svg.attr("height");

        // geoAiry projection
        var gfg = d3.geoAiry()
            .scale(width / 1.5 / Math.PI)
            .translate([width / 2, height / 2]);

        // Loading the json data
        d3.json("https://raw.githubusercontent.com/" +
            "janasayantan/datageojson/master/" +
            "geoworld%20.json",
            function (data) {

                // Draw the map
                svg.append("g")
                    .selectAll("path")
                    .data(data.features)
                    .enter().append("path")
                    .attr("fill", "green")
                    .attr("d", d3.geoPath()
                        .projection(gfg)
                    )
                    .style("stroke", "#ffff");
            });
    </script>
</body>

</html>
输出:
相关用法
- PHP imagecreatetruecolor()用法及代码示例
- p5.js year()用法及代码示例
- d3.js d3.utcTuesdays()用法及代码示例
- PHP ImagickDraw getTextAlignment()用法及代码示例
- PHP Ds\Sequence last()用法及代码示例
- PHP array_udiff_uassoc()用法及代码示例
- PHP geoip_continent_code_by_name()用法及代码示例
- d3.js d3.map.set()用法及代码示例
- PHP GmagickPixel setcolor()用法及代码示例
- PHP opendir()用法及代码示例
- PHP cal_to_jd()用法及代码示例
- d3.js d3.bisectLeft()用法及代码示例
- PHP stream_get_transports()用法及代码示例
- PHP Ds\Deque pop()用法及代码示例
注:本文由纯净天空筛选整理自jana_sayantan大神的英文原创作品 D3.js geoAiry() Function。非经特殊声明,原始代码版权归原作者所有,本译文未经允许或授权,请勿转载或复制。