Bokeh是Python中的数据可视化库,可提供高性能的交互式图表和绘图,并且可以通过笔记本,html和服务器等各种介质获取输出。 Figure类创建一个新的Figure进行绘制。它是Plot的子类,可通过默认轴,网格,工具等简化绘图创建。
bokeh.plotting.figure.annular_wedge()函数
散景库的绘图模块中的annular_wedge()函数用于将AnnularWedge字形添加到图形。
用法: annular_wedge(x, y, inner_radius, outer_radius, start_angle, end_angle, direction=’anticlock’, *, end_angle_units=’rad’, fill_alpha=1.0, fill_color=’gray’, inner_radius_units=’data’, line_alpha=1.0, line_cap=’butt’, line_color=’black’, line_dash=[], line_dash_offset=0, line_join=’bevel’, line_width=1, name=None, outer_radius_units=’data’, start_angle_units=’rad’, tags=[], **kwargs)
参数:此方法接受下面描述的以下参数:
- x:该参数是环形楔形件中心的x-coordinates。
- y:该参数是环形楔形件中心的y-coordinates。
- inner_radius:此参数是环形楔的内半径。
- outer_radius:此参数是环形楔的外半径。
- start_angle:该参数是启动环形楔块的角度。
- end_angle:此参数是结束环形楔的角度。
- direction:此参数是在起始角度和终止角度之间的行程方向。
- fill_alpha:此参数是环形楔的填充Alpha值。
- fill_color:此参数是环形楔形的填充颜色值。
- line_alpha:此参数是默认值1.0的环形楔的线alpha值。
- line_cap:此参数是具有默认对接值的环形楔的线帽值。
- line_color:此参数是默认值为黑色的环形楔形的线条颜色值。
- line_dash:此参数是默认值为[]的环形楔的线破折号。
- line_dash_offset:此参数是默认值为0的环形楔的虚线虚线偏移值。
- line_join:此参数是具有默认斜角的环形楔的线连接值。
- line_width:此参数是默认值1的环形楔的线宽值。
- mode:此参数可以是以下三个值之一:[“before”,“after”,“center”]。
- name:此参数是此模型的用户提供的名称。
- tags:此参数是该模型的用户提供的值。
Other Parameters:这些参数是** kwargs,如下所述:
- alpha:此参数用于一次设置所有alpha关键字参数。
- color:此参数用于一次设置所有颜色关键字参数。
- legend_field:此参数是数据源中应使用的列或分组的名称。
- legend_group:此参数是数据源中应使用的列或分组的名称。
- legend_label:此参数是图例条目,其标记为此处提供的确切文本。
- muted:此参数包含布尔值。
- name:此参数是用户提供的可选名称,以附加到渲染器。
- source:此参数是用户提供的数据源。
- view:此参数是用于过滤数据源的视图。
- visible:此参数包含布尔值。
- x_range_name:此参数是用于映射x-coordinates的额外范围的名称。
- y_range_name:此参数是用于映射y-coordinates的额外范围的名称。
- level:此参数指定此字形的渲染级别顺序。
返回:此方法返回GlyphRenderer值。
以下示例说明了bokeh.plotting中的bokeh.plotting.figure.annular_wedge()函数:
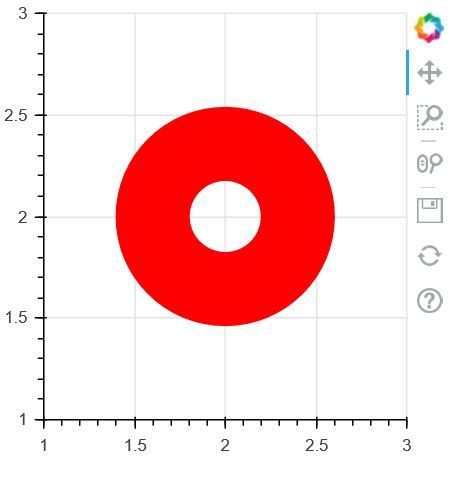
范例1:
# Implementation of bokeh function

import numpy as np
from bokeh.plotting import figure, output_file, show

x = [2]
y = [2]
r = .6

plot = figure(width = 300, height = 300)
plot.annular_wedge(x = x, y = y, inner_radius =.2,
                   outer_radius = r, start_angle = 0,
                   end_angle = 6.5, line_color = "red",
                   fill_color ="red")

show(plot)
输出:
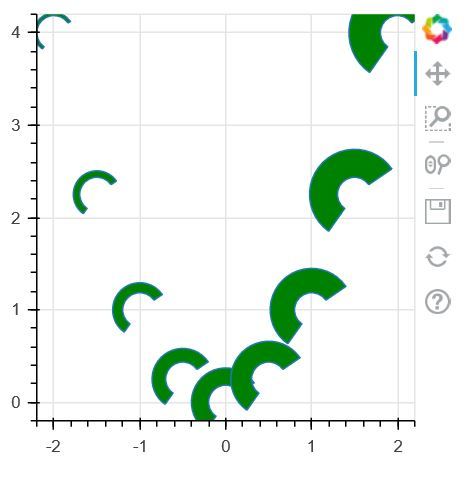
范例2:
# Implementation of bokeh function

import numpy as np
from bokeh.plotting import figure, output_file, show

N = 9
x = np.linspace(-2, 2, N)
y = x**2
r = x / 12.0 + 0.4

plot = figure(width = 300, height = 300)
plot.annular_wedge(x = x, y = y, inner_radius =.2,
                   outer_radius = r, start_angle = 0.6,
                   end_angle = 4.1, fill_color ="green")

show(plot)
输出:
相关用法
- Python Wand function()用法及代码示例
- Python Sorted()用法及代码示例
- Python Numbers choice()用法及代码示例
- Python Tkinter askopenfile()用法及代码示例
- Python ord()用法及代码示例
- Python sum()用法及代码示例
- Python round()用法及代码示例
- Python id()用法及代码示例
- Python vars()用法及代码示例
注:本文由纯净天空筛选整理自SHUBHAMSINGH10大神的英文原创作品 bokeh.plotting.figure.annular_wedge() function in Python。非经特殊声明,原始代码版权归原作者所有,本译文未经允许或授权,请勿转载或复制。