借助sympy.stats.ExGaussian()方法,我們可以獲得代表 index 修正高斯分布的連續隨機變量。
用法:sympy.stats.ExGaussian(name, mean, std, rate)
返回:Return continuous random variable.
範例1:
在這個例子中,我們可以通過使用sympy.stats.ExGaussian()通過使用該方法,我們能夠獲得代表 index 修正的高斯分布的連續隨機變量。
# Import sympy and ExGaussian
from sympy.stats import ExGaussian, density
from sympy import Symbol
mean = Symbol("mean", integer = True, positive = True)
std = Symbol("std", integer = True, positive = True)
rate = Symbol("rate", integer = True, positive = True)
z = Symbol("z")
# Using sympy.stats.ExGaussian() method
X = ExGaussian("x", mean, std, rate)
gfg = density(X)(z)
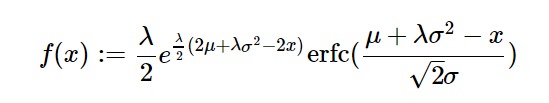
pprint(gfg)輸出:
/ 2 \
rate*\2*mean + rate*std - 2*z/
——————————- / ___ / 2 \\
2 |\/ 2 *\mean + rate*std - z/|
rate*e *erfc|—————————-|
\ 2*std /
————————————————————————
2
範例2:
# Import sympy and ExGaussian
from sympy.stats import ExGaussian, density
from sympy import Symbol

mean = 22
std = 21
rate = 7
z = 0.4

# Using sympy.stats.ExGaussian() method
X = ExGaussian("x", mean, std, rate)
gfg = density(X)(z)

pprint(gfg)
輸出:
/ ___\
3.50044639861837e+4758*erfc\74.0142857142857*\/ 2 /
相關用法
- Python zip()用法及代碼示例
- Python abs()用法及代碼示例
- Python pow()用法及代碼示例
- Python gcd()用法及代碼示例
- Python min() and max()用法及代碼示例
注:本文由純淨天空篩選整理自Jitender_1998大神的英文原創作品 sympy.stats.ExGaussian() in python。非經特殊聲明,原始代碼版權歸原作者所有,本譯文未經允許或授權,請勿轉載或複製。