step_profile() 創建配方步驟的規範,該步驟將修複除一個變量之外的所有變量的級別,並將為其餘變量創建一係列值。在為加法模型創建部分回歸圖時,此步驟非常有用。
用法
step_profile(
  recipe,
  ...,
  profile = NULL,
  pct = 0.5,
  index = 1,
  grid = list(pctl = TRUE, len = 100),
  columns = NULL,
  role = NA,
  trained = FALSE,
  skip = FALSE,
  id = rand_id("profile")
)
參數
- recipe
-
一個菜譜對象。該步驟將添加到此配方的操作序列中。
- ...
-
一個或多個選擇器函數用於為此步驟選擇變量。有關更多詳細信息,請參閱
selections()。 - profile
-
調用
dplyr::vars())以指定將分析哪個變量(請參閱selections())。如果某個列同時包含在要修複的列表和要分析的列表中,則會引發錯誤。 - pct
-
0 到 1 之間的值,是固定連續變量的百分位數。這適用於選擇器捕獲的所有連續變量。對於日期變量,根據與
pct的距離使用最小值、中值或最大值。 - index
-
定性變量的水平將被固定。如果變量是字符(不是因子),則這將是排序的唯一值的索引。這適用於選擇器捕獲的所有定性變量。
- grid
-
包含元素
pctl(邏輯)和len(整數)的命名列表。如果pctl = TRUE,則len表示用於創建分析網格的百分位數。這將創建一個介於 0 和 1 之間的網格,並且配置文件由數據的百分位數確定。例如,如果pctl = TRUE和len = 3,則配置文件將包含最小值、中值和最大值。如果是pctl = FALSE,它定義應在最小值和最大值之間創建多少個網格點。對於定性變量,該參數將被忽略(因為它們所有可能的水平都已被分析)。對於日期變量,將始終使用pctl = FALSE,因為日期沒有分位數方法。 - columns
-
所選變量名稱的字符串。該字段是一個占位符,一旦使用
prep()就會被填充。 - role
-
由於沒有創建新變量,因此此步驟未使用。
- trained
-
指示預處理數量是否已估計的邏輯。
- skip
-
一個合乎邏輯的。當
bake()烘焙食譜時是否應該跳過此步驟?雖然所有操作都是在prep()運行時烘焙的,但某些操作可能無法對新數據進行(例如處理結果變量)。使用skip = TRUE時應小心,因為它可能會影響後續操作的計算。 - id
-
該步驟特有的字符串,用於標識它。
整理
當您 tidy() 此步驟時,將返回包含列 terms(將受影響的列)和 type(已修複或已分析的列)的 tibble。
例子
data(Sacramento, package = "modeldata")

# Setup a grid across beds but keep the other values fixed
recipe(~ city + price + beds, data = Sacramento) %>%
  step_profile(-beds, profile = vars(beds)) %>%
  prep(training = Sacramento) %>%
  bake(new_data = NULL)
#> # A tibble: 6 × 3
#>   city      price  beds
#>   <fct>     <int> <int>
#> 1 ANTELOPE 220000     1
#> 2 ANTELOPE 220000     2
#> 3 ANTELOPE 220000     3
#> 4 ANTELOPE 220000     4
#> 5 ANTELOPE 220000     5
#> 6 ANTELOPE 220000     8

##########

# An *additive* model; not for use when there are interactions or
# other functional relationships between predictors

lin_mod <- lm(mpg ~ poly(disp, 2) + cyl + hp, data = mtcars)

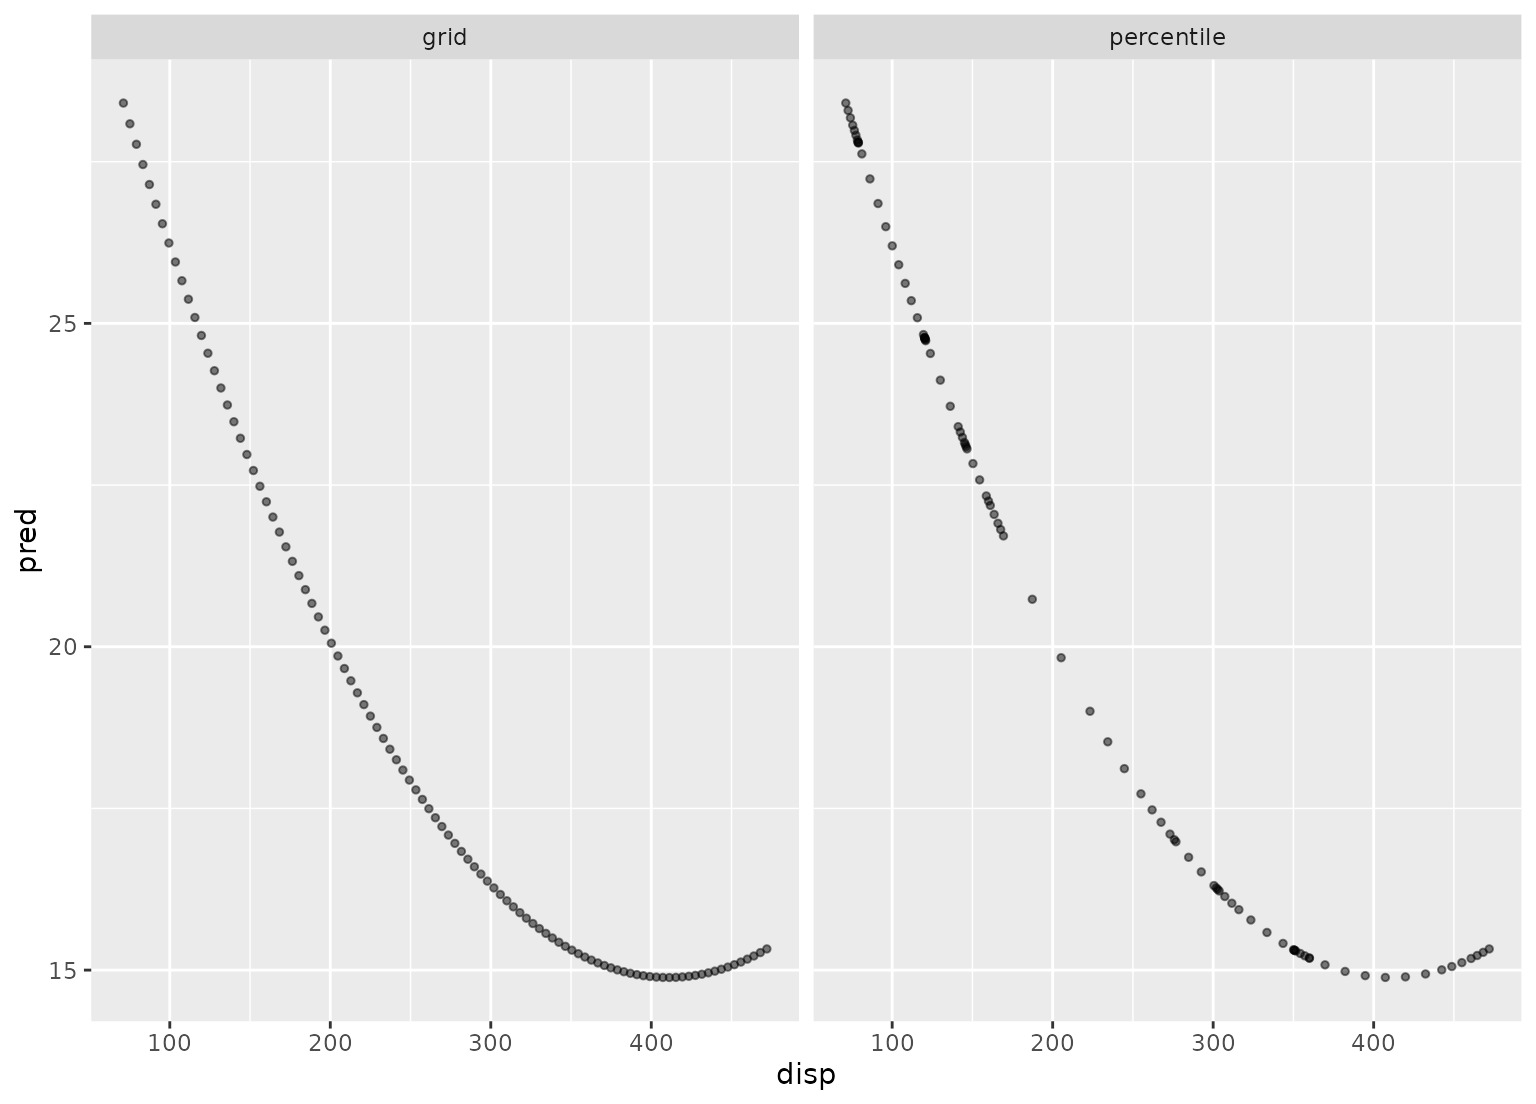
# Show the difference in the two grid creation methods

disp_pctl <- recipe(~ disp + cyl + hp, data = mtcars) %>%
  step_profile(-disp, profile = vars(disp)) %>%
  prep(training = mtcars)

disp_grid <- recipe(~ disp + cyl + hp, data = mtcars) %>%
  step_profile(
    -disp,
    profile = vars(disp),
    grid = list(pctl = FALSE, len = 100)
  ) %>%
  prep(training = mtcars)

grid_data <- bake(disp_grid, new_data = NULL)
grid_data <- grid_data %>%
  mutate(
    pred = predict(lin_mod, grid_data),
    method = "grid"
  )

pctl_data <- bake(disp_pctl, new_data = NULL)
pctl_data <- pctl_data %>%
  mutate(
    pred = predict(lin_mod, pctl_data),
    method = "percentile"
  )

plot_data <- bind_rows(grid_data, pctl_data)

library(ggplot2)

ggplot(plot_data, aes(x = disp, y = pred)) +
  geom_point(alpha = .5, cex = 1) +
  facet_wrap(~method)

相關用法
- R recipes step_poly_bernstein 廣義伯恩斯坦多項式基
- R recipes step_pls 偏最小二乘特征提取
- R recipes step_pca 主成分分析信號提取
- R recipes step_poly 正交多項式基函數
- R recipes step_percentile 百分位變換
- R recipes step_unknown 將缺失的類別分配給“未知”
- R recipes step_relu 應用(平滑)修正線性變換
- R recipes step_impute_knn 通過 k 最近鄰進行插補
- R recipes step_impute_mean 使用平均值估算數值數據
- R recipes step_inverse 逆變換
- R recipes step_ratio 比率變量創建
- R recipes step_geodist 兩個地點之間的距離
- R recipes step_nzv 近零方差濾波器
- R recipes step_nnmf 非負矩陣分解信號提取
- R recipes step_normalize 中心和比例數值數據
- R recipes step_depth 數據深度
- R recipes step_other 折疊一些分類級別
- R recipes step_harmonic 添加正弦和餘弦項以進行諧波分析
- R recipes step_corr 高相關濾波器
- R recipes step_novel 新因子水平的簡單賦值
- R recipes step_select 使用 dplyr 選擇變量
- R recipes step_regex 檢測正則表達式
- R recipes step_spline_b 基礎樣條
- R recipes step_window 移動窗口函數
- R recipes step_ica ICA 信號提取
注:本文由純淨天空篩選整理自Max Kuhn等大神的英文原創作品 Create a Profiling Version of a Data Set。非經特殊聲明,原始代碼版權歸原作者所有,本譯文未經允許或授權,請勿轉載或複製。
