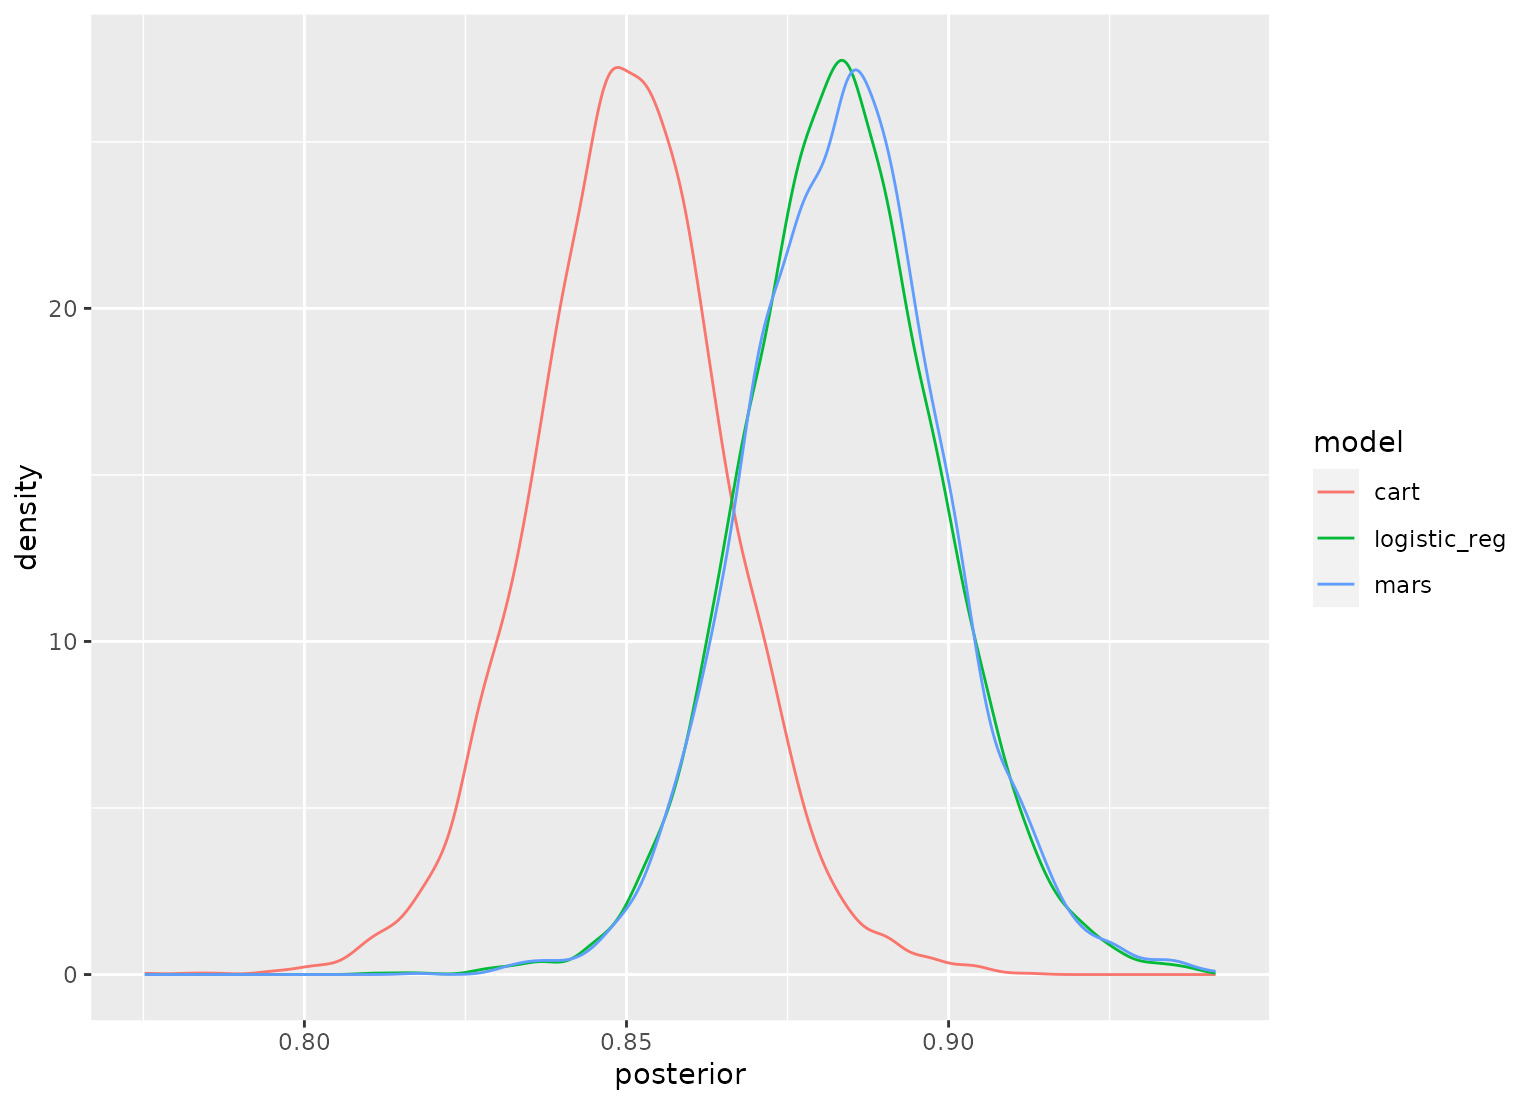
對於 posterior 和 perf_mod 類的對象,autoplot() 生成簡單的後驗分布圖。對於工作流集對象,可以生成多種類型的繪圖。
用法
# S3 method for posterior
autoplot(object, ...)

# S3 method for perf_mod
autoplot(object, ...)

# S3 method for perf_mod_workflow_set
autoplot(object, type = "intervals", prob = 0.9, size = NULL, ...)
參數
- object
-
由
perf_mod()、tidy.perf_mod()或具有計算結果的工作流集生成的對象。 - ...
-
傳遞給
geom_line(stat = "density", ...)的選項。 - type
-
值為以下之一:
"intervals"(對於使用區間估計的模型排名與後驗概率)、"posteriors"(每個模型的密度圖)或"ROPE"(對於實際等效概率與工作流排名)。 - prob
-
數字 p (0 < p < 1),表示間隔中包含的所需概率質量。
- size
-
所選指標單位的有效差異大小。例如,兩個模型之間的準確度 (
size = 0.05) 提高 5% 可能會被視為 "real" 差異。
相關用法
- R tidyposterior autoplot.posterior_diff 可視化模型差異的後驗分布
- R tidyposterior transformations 簡單的轉換函數
- R tidyposterior summary.posterior_diff 總結模型差異的後驗分布
- R tidyposterior summary.posterior 總結模型統計量的後驗分布
- R tidyr separate_rows 將折疊的列分成多行
- R tidyr extract 使用正則表達式組將字符列提取為多列
- R tidyr chop 砍伐和砍伐
- R tidyr pivot_longer_spec 使用規範將數據從寬轉為長
- R tidyr unnest_longer 將列表列取消嵌套到行中
- R tidyr uncount “計數” DataFrame
- R tidyr cms_patient_experience 來自醫療保險和醫療補助服務中心的數據
- R tidyr pivot_wider_spec 使用規範將數據從長軸轉向寬軸
- R tidyverse tidyverse_update 更新 tidyverse 軟件包
- R tidyr replace_na 將 NA 替換為指定值
- R tidyr unnest_wider 將列表列取消嵌套到列中
- R tidymodels tidymodels_update 更新 tidymodels 包
- R tidyr full_seq 在向量中創建完整的值序列
- R tidyr nest 將行嵌套到 DataFrame 的列表列中
- R tidyverse tidyverse_logo tidyverse 徽標,使用 ASCII 或 Unicode 字符
- R tidyr separate 使用正則表達式或數字位置將字符列分成多列
- R tidyr pivot_wider 將數據從長軸轉向寬軸
- R tidyr nest_legacy Nest() 和 unnest() 的舊版本
- R tidyr separate_longer_delim 將字符串拆分為行
- R tidyr gather 將列收集到鍵值對中
- R tidyr hoist 將值提升到列表列之外
注:本文由純淨天空篩選整理自Max Kuhn等大神的英文原創作品 Visualize the Posterior Distributions of Model Statistics。非經特殊聲明,原始代碼版權歸原作者所有,本譯文未經允許或授權,請勿轉載或複製。