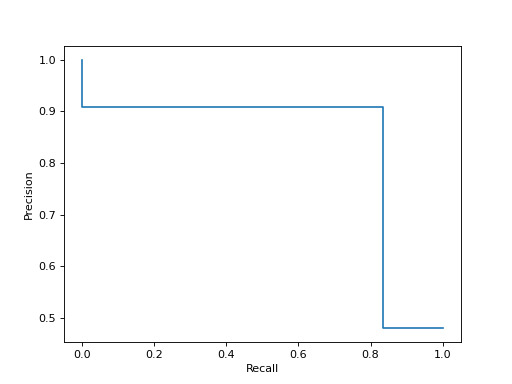
本文簡要介紹python語言中 sklearn.metrics.PrecisionRecallDisplay 的用法。
用法:
class sklearn.metrics.PrecisionRecallDisplay(precision, recall, *, average_precision=None, estimator_name=None, pos_label=None)精確召回可視化。
建議使用
from_estimator或from_predictions創建PredictionRecallDisplay。所有參數都存儲為屬性。在用戶指南中閱讀更多信息。
- precision:ndarray
精度值。
- recall:ndarray
召回值。
- average_precision:浮點數,默認=無
平均精度。如果沒有,則不顯示平均精度。
- estimator_name:str,默認=無
估算器的名稱。如果沒有,則不顯示估計器名稱。
- pos_label:str 或 int,默認 = 無
被認為是正類的類。如果為 None,則該類將不會顯示在圖例中。
- line_:matplotlib 藝術家
精確召回曲線。
- ax_:matplotlib 軸
具有精確召回曲線的軸。
- figure_:matplotlib 圖
包含曲線的圖。
參數:
屬性:
例子:
>>> import matplotlib.pyplot as plt
>>> from sklearn.datasets import make_classification
>>> from sklearn.metrics import (precision_recall_curve,
...                              PrecisionRecallDisplay)
>>> from sklearn.model_selection import train_test_split
>>> from sklearn.svm import SVC
>>> X, y = make_classification(random_state=0)
>>> X_train, X_test, y_train, y_test = train_test_split(X, y,
...                                                     random_state=0)
>>> clf = SVC(random_state=0)
>>> clf.fit(X_train, y_train)
SVC(random_state=0)
>>> predictions = clf.predict(X_test)
>>> precision, recall, _ = precision_recall_curve(y_test, predictions)
>>> disp = PrecisionRecallDisplay(precision=precision, recall=recall)
>>> disp.plot()
<...>
>>> plt.show()
相關用法
- Python sklearn PrecisionRecallDisplay.from_predictions用法及代碼示例
- Python sklearn PrecisionRecallDisplay.from_estimator用法及代碼示例
- Python sklearn PredefinedSplit用法及代碼示例
- Python sklearn Product用法及代碼示例
- Python sklearn PowerTransformer.inverse_transform用法及代碼示例
- Python sklearn ParameterGrid用法及代碼示例
- Python sklearn PatchExtractor用法及代碼示例
- Python sklearn PolynomialFeatures用法及代碼示例
- Python sklearn PassiveAggressiveClassifier用法及代碼示例
- Python sklearn PLSRegression用法及代碼示例
- Python sklearn PCA用法及代碼示例
- Python sklearn Perceptron用法及代碼示例
- Python sklearn PairwiseKernel用法及代碼示例
- Python sklearn PLSSVD用法及代碼示例
- Python sklearn PLSCanonical用法及代碼示例
- Python sklearn Pipeline用法及代碼示例
- Python sklearn PassiveAggressiveRegressor用法及代碼示例
- Python sklearn PowerTransformer用法及代碼示例
- Python sklearn PolynomialCountSketch用法及代碼示例
- Python sklearn ParameterSampler用法及代碼示例
- Python sklearn PartialDependenceDisplay.from_estimator用法及代碼示例
- Python sklearn PoissonRegressor用法及代碼示例
- Python sklearn jaccard_score用法及代碼示例
- Python sklearn WhiteKernel用法及代碼示例
- Python sklearn CalibrationDisplay.from_predictions用法及代碼示例
注:本文由純淨天空篩選整理自scikit-learn.org大神的英文原創作品 sklearn.metrics.PrecisionRecallDisplay。非經特殊聲明,原始代碼版權歸原作者所有,本譯文未經允許或授權,請勿轉載或複製。
