用法:
RandomState.lognormal(mean=0.0, sigma=1.0, size=None)從log-normal分布中抽取樣本。
從具有指定平均值,標準偏差和數組形狀的log-normal分布中抽取樣本。請注意,均值和標準差不是分布本身的值,而是其基礎正態分布的值。
參數: - mean: : float 或 array_like of floats, 可選參數
基本正態分布的平均值。默認值為0。
- sigma: : float 或 array_like of floats, 可選參數
基本正態分布的標準偏差。必須為非負數。默認值為1。
- size: : int 或 tuple of ints, 可選參數
輸出形狀。如果給定的形狀是
(m, n, k), 然後m * n * k抽取樣品。如果尺寸是None(默認),如果返回一個值mean和sigma都是標量。除此以外,np.broadcast(mean, sigma).size抽取樣品。
返回值: - out: : ndarray或標量
從參數化的log-normal分布中抽取樣本。
注意:
如果log(x)正態分布,則變量x的分布為log-normal。 log-normal分布的概率密度函數為:

哪裏
 是卑鄙的
是卑鄙的 是變量的正態分布對數的標準偏差。如果隨機變量是大量獨立identically-distributed變量的乘積,則會產生log-normal分布,其方式與如果變量是大量獨立identically-distributed變量的總和會產生正態分布的方式相同。
參考文獻:
[1] Limpert,E.,Stahel,W. A.和Abbt,M.,“跨科學的Log-normal分布:鍵和線索”,《生物科學》,第1卷。 51,第5號,2001年5月。https://stat.ethz.ch/~stahel/lognormal/bioscience.pdf [2] Reiss,R.D。和Thomas,M。,“極值的統計分析”,巴塞爾:Birkhauser Verlag,2001年,第31-32頁。 例子:
從分布中抽取樣本:
>>> mu, sigma = 3., 1. # mean and standard deviation
>>> s = np.random.lognormal(mu, sigma, 1000)
顯示樣本的直方圖以及概率密度函數:
>>> import matplotlib.pyplot as plt
>>> count, bins, ignored = plt.hist(s, 100, density=True, align='mid')
>>> x = np.linspace(min(bins), max(bins), 10000) >>> pdf = (np.exp(-(np.log(x) - mu)**2 / (2 * sigma**2)) ... / (x * sigma * np.sqrt(2 * np.pi)))>>> plt.plot(x, pdf, linewidth=2, color='r') >>> plt.axis('tight') >>> plt.show()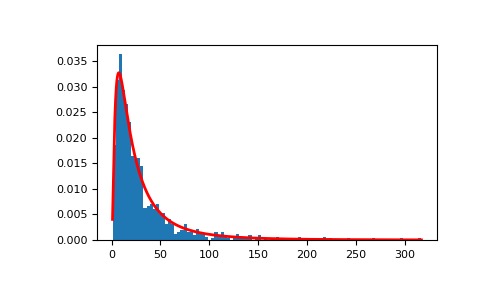
證明通過log-normal概率密度函數可以很好地擬合均勻分布的隨機樣本的乘積。
>>> # Generate a thousand samples:each is the product of 100 random
>>> # values, drawn from a normal distribution.
>>> b = []
>>> for i in range(1000):
...    a = 10. + np.random.standard_normal(100)
...    b.append(np.product(a))
>>> b = np.array(b) / np.min(b) # scale values to be positive >>> count, bins, ignored = plt.hist(b, 100, density=True, align='mid') >>> sigma = np.std(np.log(b)) >>> mu = np.mean(np.log(b))>>> x = np.linspace(min(bins), max(bins), 10000) >>> pdf = (np.exp(-(np.log(x) - mu)**2 / (2 * sigma**2)) ... / (x * sigma * np.sqrt(2 * np.pi)))>>> plt.plot(x, pdf, color='r', linewidth=2) >>> plt.show()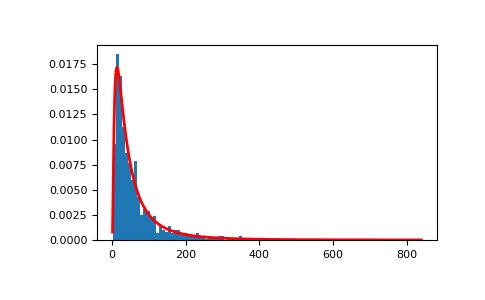
相關用法
注:本文由純淨天空篩選整理自 numpy.random.mtrand.RandomState.lognormal。非經特殊聲明,原始代碼版權歸原作者所有,本譯文未經允許或授權,請勿轉載或複製。