用法:
RandomState.gamma(shape, scale=1.0, size=None)從Gamma分布中抽取樣本。
從具有指定參數,形狀(有時指定為“k”)和比例尺(有時指定為“theta”)的Gamma分布中抽取樣本,其中兩個參數均大於0。
參數: - shape: : float 或 array_like of floats
伽瑪分布的形狀。必須為非負數。
- scale: : float 或 array_like of floats, 可選參數
伽瑪分布的比例。必須為非負數。默認值等於1。
- size: : int 或 tuple of ints, 可選參數
輸出形狀。如果給定的形狀是
(m, n, k), 然後m * n * k抽取樣品。如果尺寸是None(默認),如果返回一個值shape和scale都是標量。除此以外,np.broadcast(shape, scale).size抽取樣品。
返回值: - out: : ndarray或標量
從參數化的伽瑪分布中抽取樣本。
注意:
Gamma分布的概率密度為

哪裏
 是形狀和
是形狀和 規模,以及
規模,以及 是Gamma函數。
Gamma分布通常用於對電子組件的失效時間進行建模,並且在與泊鬆分布事件之間的等待時間相關的過程中自然產生。
參考文獻:
[1] 魏斯汀(Eric W.),“伽瑪分布”來自MathWorld-A Wolfram Web資源。http://mathworld.wolfram.com/GammaDistribution.html [2] 維基百科,“Gamma distribution”,https://en.wikipedia.org/wiki/Gamma_distribution 例子:
從分布中抽取樣本:
>>> shape, scale = 2., 2.  # mean=4, std=2*sqrt(2)
>>> s = np.random.gamma(shape, scale, 1000)
顯示樣本的直方圖以及概率密度函數:
>>> import matplotlib.pyplot as plt
>>> import scipy.special as sps  # doctest:+SKIP
>>> count, bins, ignored = plt.hist(s, 50, density=True)
>>> y = bins**(shape-1)*(np.exp(-bins/scale) /  # doctest:+SKIP
...                      (sps.gamma(shape)*scale**shape))
>>> plt.plot(bins, y, linewidth=2, color='r')  # doctest:+SKIP
>>> plt.show()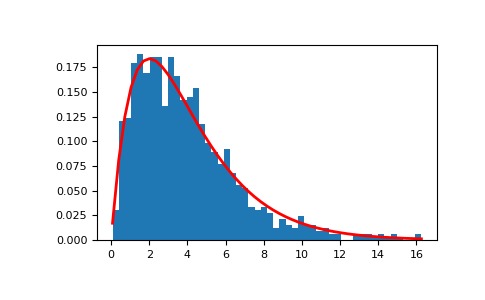
相關用法
注:本文由純淨天空篩選整理自 numpy.random.mtrand.RandomState.gamma。非經特殊聲明,原始代碼版權歸原作者所有,本譯文未經允許或授權,請勿轉載或複製。