Pandas.DataFrame.hist()函數有助於理解數字變量的分布。此函數將值拆分為數字變量。其主要函數是製作給定數據幀的直方圖。
數據的分布由直方圖表示。使用函數Pandas DataFrame.hist()時,它將在DataFrame中的每個係列上自動調用函數matplotlib.pyplot.hist()。結果,我們獲得了每列一個直方圖。
用法:DataFrame.hist(data, column=None, by=None, grid=True, xlabelsize=None, xrot=None, ylabelsize=None, yrot=None, ax=None, sharex=False, sharey=False, figsize=None, layout=None, bins=10, backend=None, legend=False, **kwargs)
參數:
data:DataFrame
column:str或序列
xlabelsize:int,默認值無
ylabelsize:int,默認值無
ax:Matplotlib軸對象,默認為無
**誇克
所有其他繪圖關鍵字參數將傳遞給matplotlib.pyplot.hist()。
Return:
matplotlib.AxesSubplot或numpy.ndarray
範例1:創建2列Pandas DataFrame 的直方圖
有時我們需要繪製 DataFrame 列的直方圖,以便對其進行更深入的分析。在這種情況下,dataframe.hist()函數很有幫助。使用此函數,我們可以繪製任意數量列的直方圖。
Python3
# Importing pandas library
import pandas as pd

# Creating a Data frame
values = pd.DataFrame({
    'Length':[2.7, 8.7, 3.4, 2.4, 1.9],
    'Breadth':[4.24, 2.67, 7.6, 7.1, 4.9]
})

# Creating Histograms of columns 'Length'
# and 'Breadth' using Dataframe.hist()
# function
hist = values.hist(bins=5)
輸出:
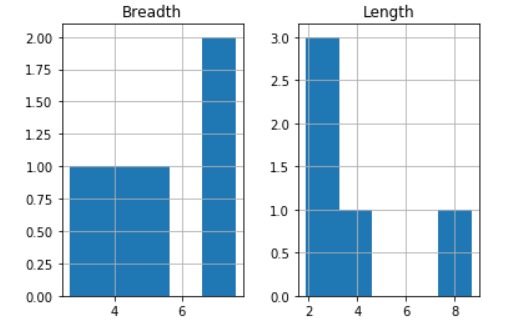
在上麵的示例中,我們使用dataframe.hist()函數繪製了“長度”和“寬度”列的直方圖。
範例2:創建3列 Pandas DataFrame 的直方圖
Python3
# Importing pandas library
import pandas as pd

# Creating a Data frame
values = pd.DataFrame({
    'Length':[2.7, 8.7, 3.4, 2.4, 1.9],
    'Breadth':[4.24, 2.67, 7.6, 7.1, 4.9],
    'Height':[5.8, 5.5, 7.8, 10.88, 0.1]})

# Creating Histograms of columns 'Length',
# 'Breadth' and 'Height' using Dataframe.hist()
# function
hist = values.hist(bins=12)
輸出:
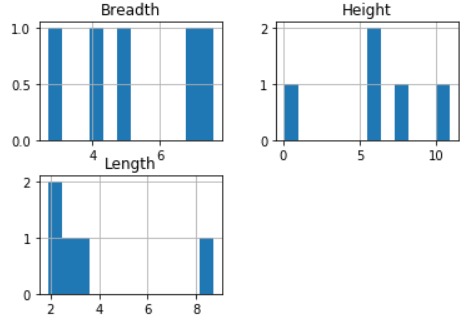
在上麵的示例中,我們使用dataframe.hist()函數繪製了“長度”,“寬度”和“高度”列的直方圖。
範例3:創建4列Pandas DataFrame 的直方圖
Python3
# Importing pandas library
import pandas as pd

# Creating a Data frame
values = pd.DataFrame({
    'Length':[2.7, 8.7, 3.4, 2.4, 1.9],
    'Breadth':[4.24, 2.67, 7.6, 7.1, 4.9],
    'Height':[5.8, 5.5, 7.8, 10.88, 0.1],
    'Weight':[20, 40.8, 55.8, 7.2, 48]
})

# Creating Histograms of columns 'Length',
# 'Breadth', 'Height' and 'Weight'
# using Dataframe.hist() function
hist = values.hist(bins=8)
輸出:
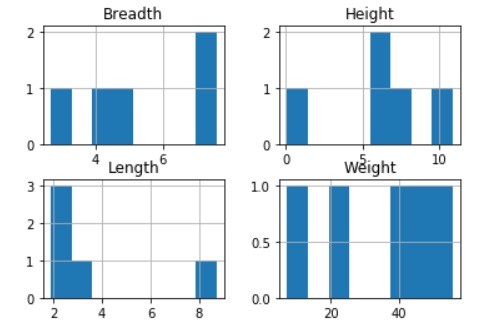
在上麵的示例中,我們使用dataframe.hist()函數繪製了“長度”,“寬度”,“高度”和“重量”列的直方圖。
相關用法
- Python Wand function()用法及代碼示例
- Python Sorted()用法及代碼示例
- Python Numbers choice()用法及代碼示例
- Python Tkinter askopenfile()用法及代碼示例
- Python ord()用法及代碼示例
- Python sum()用法及代碼示例
- Python round()用法及代碼示例
- Python id()用法及代碼示例
- Python vars()用法及代碼示例
注:本文由純淨天空篩選整理自vanshgaur14866大神的英文原創作品 Pandas.DataFrame.hist() function in Python。非經特殊聲明,原始代碼版權歸原作者所有,本譯文未經允許或授權,請勿轉載或複製。