Matplotlib是Python中的一個庫,它是數字的-NumPy庫的數學擴展。 Pyplot是Matplotlib模塊的基於狀態的接口,該模塊提供了MATLAB-like接口。在Pyplot中可以使用各種圖,例如線圖,輪廓圖,直方圖,散點圖,3D圖等。
matplotlib.pyplot.subplots_adjust()函數
matplotlib庫的pyplot模塊中的subplots_adjust()函數用於調整子圖布局。
用法: matplotlib.pyplot.subplots_adjust(left=None, bottom=None, right=None, top=None, wspace=None, hspace=None)
參數:此方法接受以下描述的參數:
- left:此參數是該圖子圖的左側。
- right:此參數是該圖子圖的右側。
- bottom:此參數是該圖子圖的底部。
- top:此參數是該圖子圖的頂部。
- wspace:此參數是為子圖之間的空間保留的寬度量,表示為平均軸寬度的一部分。
- hspace:此參數是為子圖之間的空間保留的高度量,表示為平均軸高度的一部分。
以下示例說明了matplotlib.pyplot中的matplotlib.pyplot.subplots_adjust()函數:
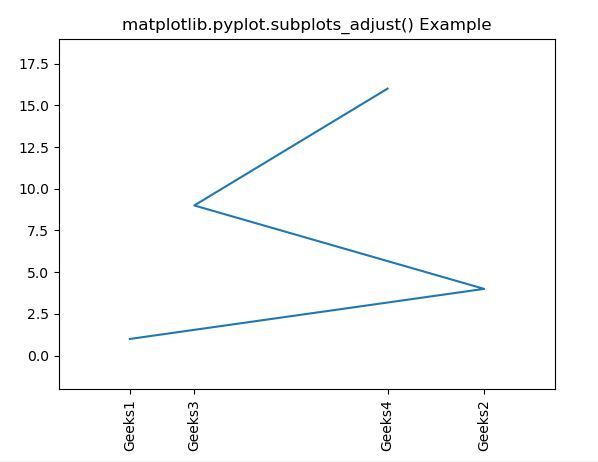
範例1:
# Implementation of matplotlib function
import matplotlib.pyplot as plt


x = [1, 12, 3, 9]
y = [1, 4, 9, 16]
labels = ['Geeks1', 'Geeks2', 'Geeks3', 'Geeks4']

plt.plot(x, y)
plt.xticks(x, labels, rotation ='vertical')

plt.margins(0.2)
plt.subplots_adjust(bottom = 0.15)

plt.title('matplotlib.pyplot.subplots_adjust() Example')
plt.show()
輸出:
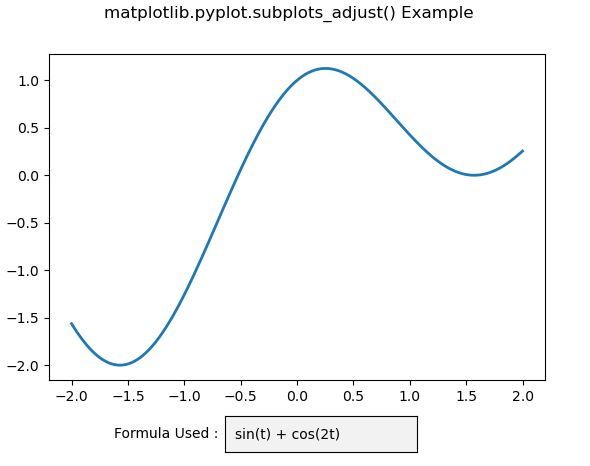
範例2:
# Implementation of matplotlib function
import numpy as np
import matplotlib.pyplot as plt
from matplotlib.widgets import TextBox


fig, ax = plt.subplots()
plt.subplots_adjust(bottom = 0.2)
t = np.arange(-2.0, 2.0, 0.001)
s = np.sin(t)+np.cos(2 * t)
initial_text = "sin(t) + cos(2t)"
l, = plt.plot(t, s, lw = 2)

def submit(text):

    ydata = eval(text)
    l.set_ydata(ydata)
    ax.set_ylim(np.min(ydata), np.max(ydata))
    plt.draw()

axbox = plt.axes([0.4, 0.05, 0.3, 0.075])
text_box = TextBox(axbox, 'Formula Used:',
                   initial = initial_text)

text_box.on_submit(submit)

fig.suptitle('matplotlib.pyplot.subplots_adjust() Example')
plt.show()
輸出:
相關用法
注:本文由純淨天空篩選整理自SHUBHAMSINGH10大神的英文原創作品 Matplotlib.pyplot.subplots_adjust() in Python。非經特殊聲明,原始代碼版權歸原作者所有,本譯文未經允許或授權,請勿轉載或複製。