Matplotlib是Python中的一個庫,它是數字的-NumPy庫的數學擴展。 Pyplot是Matplotlib模塊的基於狀態的接口,該模塊提供了MATLAB-like接口。在Pyplot中可以使用各種圖,例如線圖,輪廓圖,直方圖,散點圖,3D圖等。
matplotlib.pyplot.sci()函數
matplotlib庫的pyplot模塊中的sci()函數用於設置當前圖像。
用法: matplotlib.pyplot.sci(im)
參數:
- im:該圖像將成為顏色圖函數的目標。
返回值:此方法不返回任何值。
以下示例說明了matplotlib.pyplot中的matplotlib.pyplot.sci()函數:
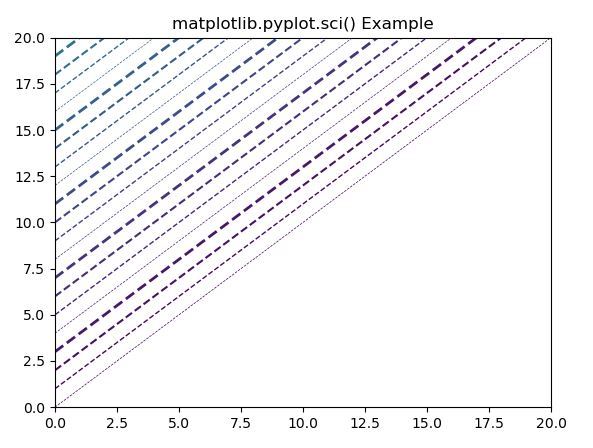
範例1:
import matplotlib.pyplot as plt
from matplotlib.collections import LineCollection
from matplotlib import colors as mcolors

import numpy as np

N = 50
x = np.arange(N)

ys = [x + i for i in x]

fig, ax = plt.subplots()
ax.set_xlim(0, 20)
ax.set_ylim(0, 20)

line_segments = LineCollection([np.column_stack([x, y]) for y in ys],
                               linewidths =(0.5, 1, 1.5, 2),
                               linestyles ='dashed', color ="#eeffdd")

line_segments.set_array(1/(x + 1))
ax.add_collection(line_segments)
line_segments.set_array(x)

plt.sci(line_segments)
plt.title('matplotlib.pyplot.sci() Example')

plt.show()
輸出:
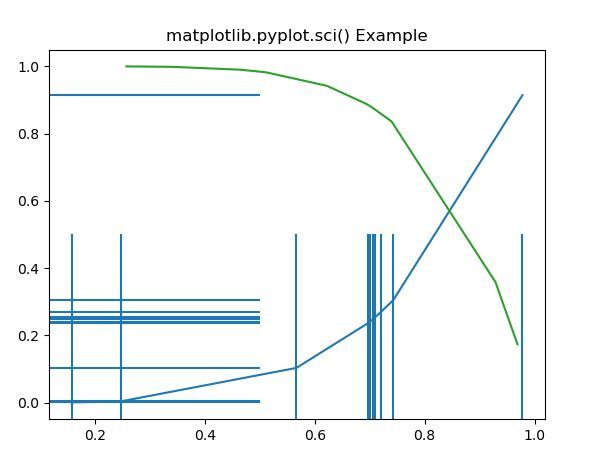
範例2:
import matplotlib.pyplot as plt
from matplotlib.collections import EventCollection
from matplotlib.collections import LineCollection
import numpy as np

np.random.seed(19680801)
xvalue = np.random.random([2, 10])
xvalue1 = xvalue[0,:]
xvalue2 = xvalue[1,:]
xvalue1.sort()
xvalue2.sort()

yvalue1 = xvalue1 ** 4
yvalue2 = 1 - xvalue2 ** 6

fig = plt.figure()
ax = fig.add_subplot(1, 1, 1)
ax.plot(xvalue1, yvalue1, color ='tab:blue')
ax.plot(xvalue2, yvalue2, color ='tab:green')

xresult1 = EventCollection(xvalue1, color ='tab:blue')
yresult1 = EventCollection(yvalue1, color ='tab:blue',
                           orientation ='vertical')
ax.add_collection(xresult1)
ax.add_collection(yresult1)

plt.sci(xresult1)
plt.title('matplotlib.pyplot.sci() Example')

plt.show()
輸出:
注:本文由純淨天空篩選整理自SHUBHAMSINGH10大神的英文原創作品 Matplotlib.pyplot.sci() in Python。非經特殊聲明,原始代碼版權歸原作者所有,本譯文未經允許或授權,請勿轉載或複製。