Matplotlib是Python中非常有用的可視化庫。它是一個基於NumPy數組的多平台數據可視化庫,旨在與更廣泛的SciPy堆棧配合使用。可視化起著非常重要的作用,因為它有助於我們理解大量數據並提取知識。
Matplotlib.pyplot.savefig()
顧名思義,savefig()方法用於保存繪製數據後創建的圖形。使用此方法可以將創建的圖形保存到我們的本地計算機中。
用法: savefig(fname, dpi=None, facecolor=’w’, edgecolor=’w’, orientation=’portrait’, papertype=None, format=None, transparent=False, bbox_inches=None, pad_inches=0.1, frameon=None, metadata=None)
參數:
| PARAMETERS | DESCRIPTION |
|---|---|
| fname | 圖片的文件名是.png,pdf格式的文件是.pdf。 也可以在此處指定文件位置。 |
| dpi | 每英寸的點數(圖像質量) |
| papertype | 紙張類型可以是“ a0至a10”,“executive”, “ b0至b10”,“letter”,“legal”,“ledger”。 |
| format | 文件格式,例如.png,.pdf。 |
| 麵色和邊色 | 默認為白色。 |
| bbox_inches | 將其設置為“tight”可以正確保存所保存的圖形。 |
| pad_inches | 在保存的圖形周圍填充。 |
| transparent | 使圖片的背景透明。 |
| Orientation | 橫向或縱向。 |
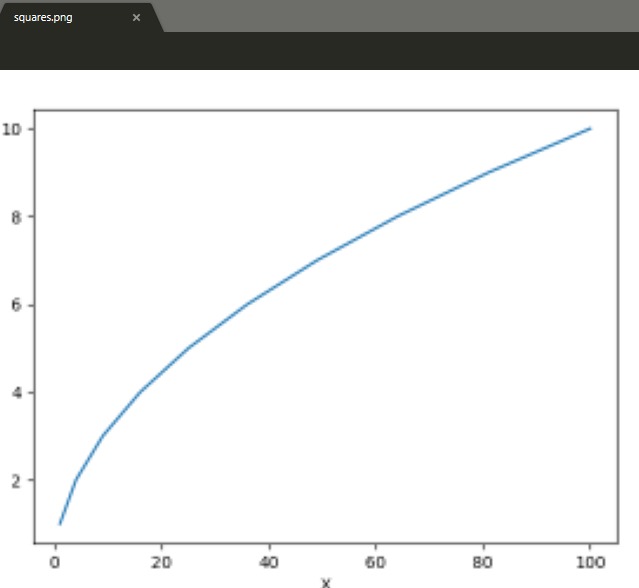
範例1:
# importing required modules
import matplotlib.pyplot as plt

# creating plotting data
xaxis =[1, 4, 9, 16, 25, 36, 49, 64, 81, 100]
yaxis =[1, 2, 3, 4, 5, 6, 7, 8, 9, 10]

# plotting
plt.plot(xaxis, yaxis)
plt.xlabel("X")
plt.ylabel("Y")

# saving the file.Make sure you
# use savefig() before show().
plt.savefig("squares.png")

plt.show()
輸出:
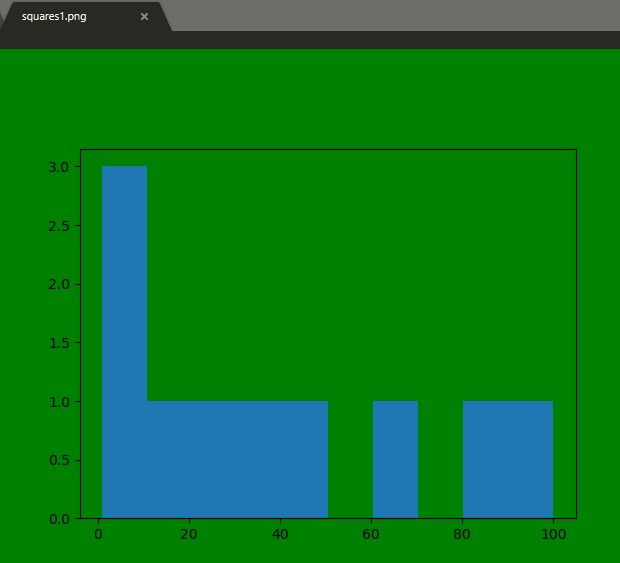
範例2:
# importing the modules
import matplotlib.pyplot as plt


# creating data and plotting a histogram
x =[1, 4, 9, 16, 25, 36, 49, 64, 81, 100]
plt.hist(x)

# saving the figure.
plt.savefig("squares1.png",
            bbox_inches ="tight",
            pad_inches = 1,
            transparent = True,
            facecolor ="g",
            edgecolor ='w',
            orientation ='landscape')

plt.show()
輸出:
相關用法
注:本文由純淨天空篩選整理自anuragnaren2108大神的英文原創作品 Matplotlib.pyplot.savefig() in Python。非經特殊聲明,原始代碼版權歸原作者所有,本譯文未經允許或授權,請勿轉載或複製。