Matplotlib是Python中令人驚歎的可視化庫,用於二維陣列圖。 Matplotlib是一個基於NumPy數組的多平台數據可視化庫,旨在與更廣泛的SciPy堆棧配合使用。
matplotlib.pyplot.rc()
matplotlib.pyplot.rc()函數用於rc參數。 rc中的分組是通過“分組”完成的(例如,對於行)。對於軸上的線,組為線寬。軸的組是facecolor,依此類推。列表或元組也可以充當組名(例如xtick,ytick)。 Kwargs是一個名稱/值對,大致上是一個字典,例如:
用法:
rc(‘lines’, linewidth=3, color=’g’)
它設置當前的rc參數,與
rcParams[‘lines.linewidth’] = 3
rcParams[‘lines.color’] = ‘g’
要保存交互式用戶的輸入,可以使用以下別名:
| 別名 | 屬性 |
|---|---|
| ‘lw’ | '行寬' |
| ‘ls’ | “線型” |
| ‘c’ | '顏色' |
| ‘fc’ | “臉色” |
| ‘ec’ | “ edgecolor” |
| ‘mew’ | “ markeredgewidth” |
| ‘aa’ | “抗鋸齒” |
因此,一次可以縮寫上述rc命令,如下所示
rc(‘lines’, lw=3, c=’g’)
注意:可以使用pythons kwargs字典存儲其默認參數的字典。例如,
font = {‘family’:‘monospace’,
‘weight’:‘italic’,
‘size’ :‘medium’}
# pass in the font dict as kwargs
rc(‘font’, **font)
這有助於在不同配置之間輕鬆切換。您還可以使用matplotlib.style.use('default')或rcdefaults()在更改後恢複rc參數。
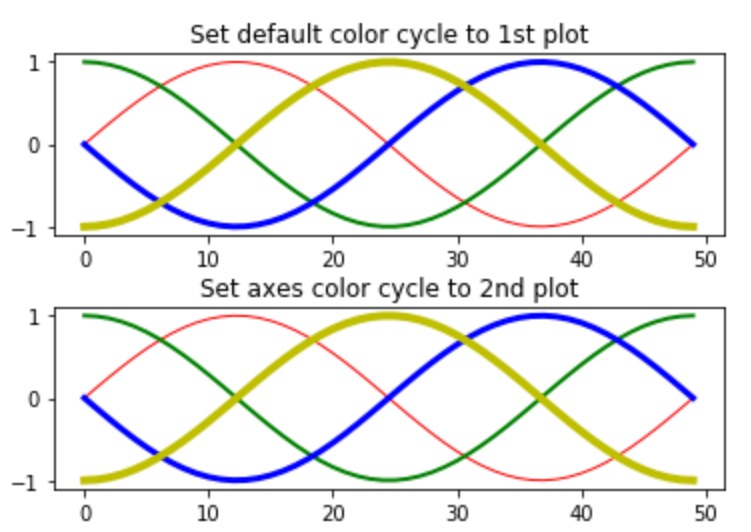
範例1:
from cycler import cycler
import numpy as np
import matplotlib.pyplot as plt


# setting up a custom cycler
sample_cycler = (cycler(color =['r', 'g',
                                'b', 'y']) +
                 cycler(lw =[1, 2, 3, 4]))

# using the rc function
plt.rc('lines', linewidth = 4)
plt.rc('axes', prop_cycle = sample_cycler)

A = np.linspace(0, 2 * np.pi, 50)
line_offsets = np.linspace(0, 2 * np.pi, 4,
                           endpoint = False)

B = np.transpose([np.sin(A + phi) for phi in line_offsets])

figure, (axes0, axes1) = plt.subplots(nrows = 2)
axes0.plot(B)
axes0.set_title('Set default color cycle to 1st plot')

axes1.set_prop_cycle(sample_cycler)
axes1.plot(B)
axes1.set_title('Set axes color cycle to 2nd plot')

# Adding space between the two plots.
figure.subplots_adjust(hspace = 0.4)
plt.show()
輸出:
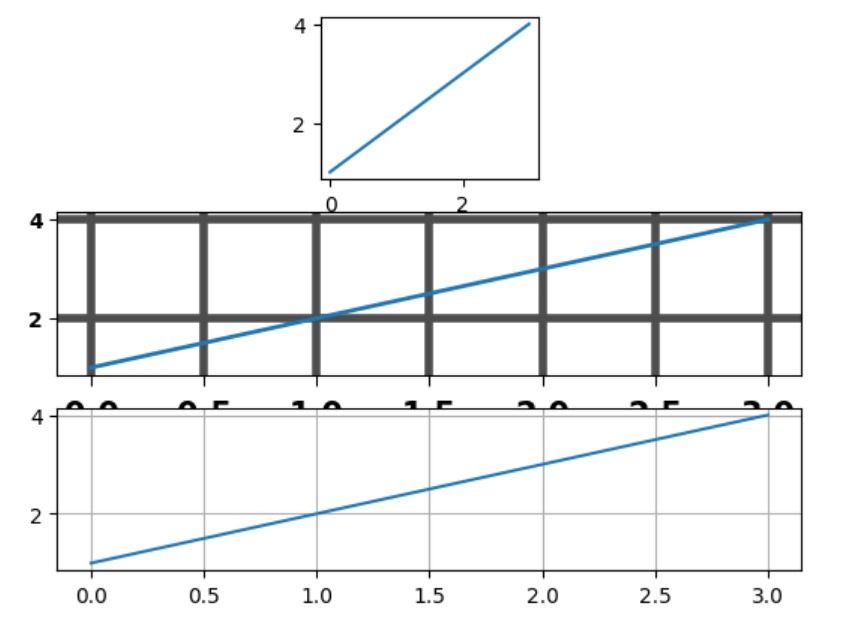
範例2:
import matplotlib.pyplot as plt


plt.subplot(332)
plt.plot([1, 2, 3, 4])

# setting  the axes attributes
# before the call to subplot
plt.rc('font', weight ='bold')
plt.rc('xtick.major', size = 5, pad = 7)
plt.rc('xtick', labelsize = 15)

# setting aliases for color, linestyle
# and linewidth; gray, solid, thick
plt.rc('grid', c ='0.3', ls ='-', lw = 4)
plt.rc('lines', lw = 2, color ='g')
plt.subplot(312)

plt.plot([1, 2, 3, 4])
plt.grid(True)

# set changes to default value
plt.rcdefaults()
plt.subplot(313)
plt.plot([1, 2, 3, 4])
plt.grid(True)
plt.show()
輸出:
相關用法
注:本文由純淨天空篩選整理自RajuKumar19大神的英文原創作品 Matplotlib.pyplot.rc() in Python。非經特殊聲明,原始代碼版權歸原作者所有,本譯文未經允許或授權,請勿轉載或複製。