借助pyplot.plotfile()方法,我們可以直接從給定的csv文件中繪製圖形,而不必通過使用來為特定屬性製作單獨的 DataFrame pyplot.plotfile()方法。
用法: pyplot.plotfile(datafile, (attr1, attr2, .....attrn))
返回:返回圖形上的屬性圖。
範例1:
在這個例子中,我們可以通過使用pyplot.plotfile()方法,我們可以通過使用給定屬性在圖形上繪製csv文件數據pyplot.plotfile()方法。
# import matplotlib
import matplotlib.pyplot as plt
# Provide the location of datafile
data = 'location_of_data_file'
# Using pyplot.plotfile() method
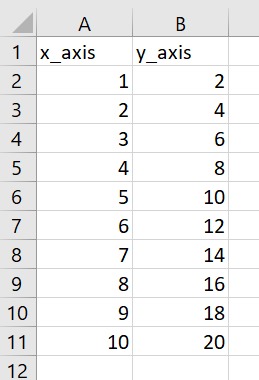
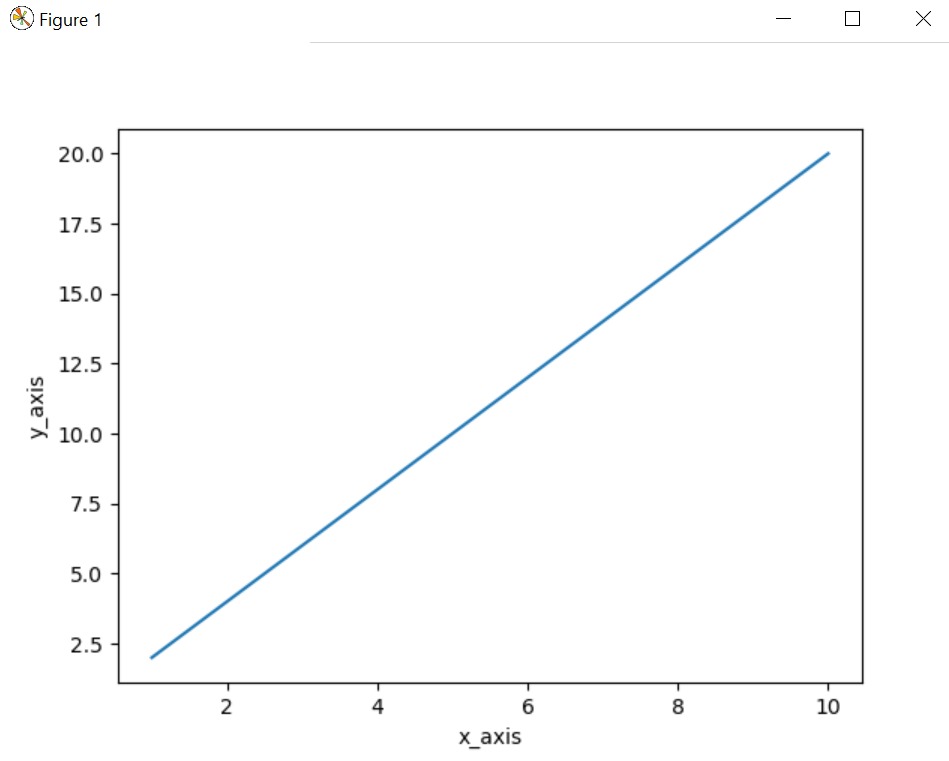
plt.plotfile(data, ('x_axis', 'y_axis'))
plt.show()示例1的數據文件:
輸出:
範例2:
# import matplotlib
import matplotlib.pyplot as plt
# Provide the location of datafile
data = 'location_of_data_file'
# Using pyplot.plotfile() method
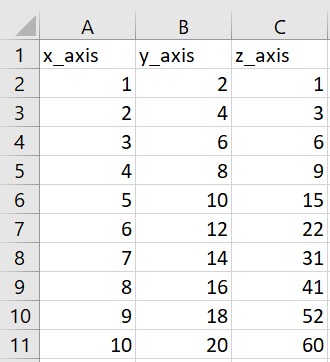
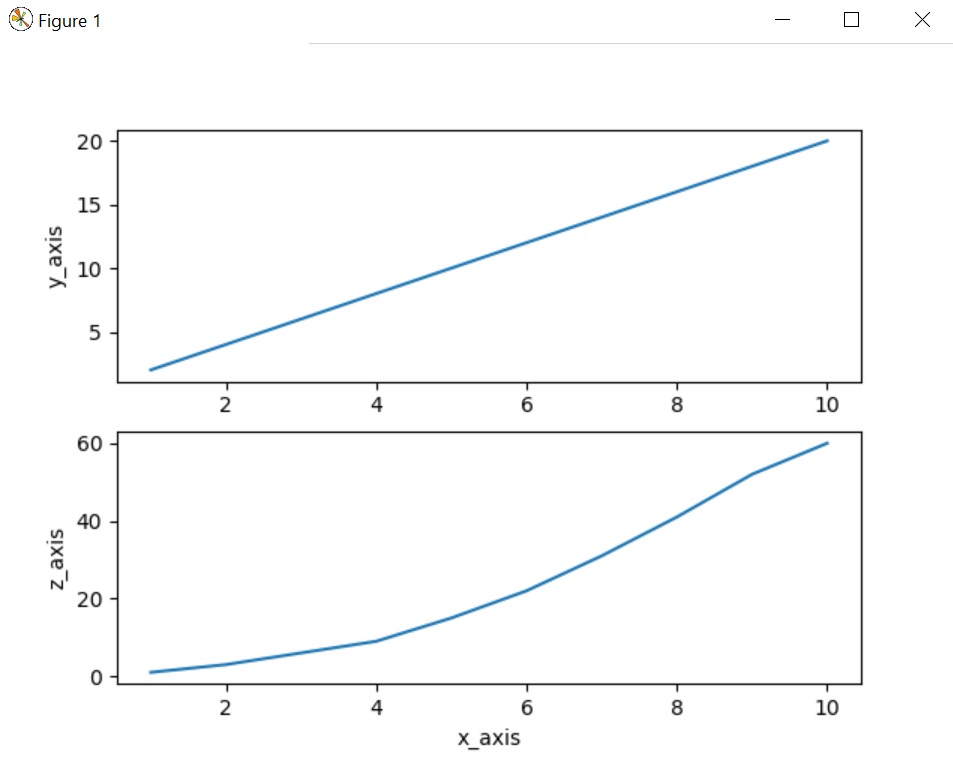
plt.plotfile(data, ('x_axis', 'y_axis', 'z_axis'))
plt.show()示例2的數據文件:
輸出:
注:本文由純淨天空篩選整理自Jitender_1998大神的英文原創作品 Matplotlib.pyplot.plotfile() in Python。非經特殊聲明,原始代碼版權歸原作者所有,本譯文未經允許或授權,請勿轉載或複製。