先決條件: Matplotlib
Matplotlib.pyplot.margins()是用於設置x和y軸邊距的函數。所有輸入參數的浮點數都必須在[0,1]範圍內。我們不能同時傳遞位置參數和關鍵字參數,因為這會引發TypeError。添加到軸每個限製的填充是該軸的數據間隔乘以邊距乘以。如果未提供任何參數,則現有邊距保持不變。指定邊距會更改auto-scaling。
- 如果僅提供一個浮點值,則將其用作x和y軸的邊距。
- 如果提供兩個浮點值,將使用它們分別指定x-margin和y-margin軸。
用法:
邊距(x,y,緊)
參數
-x,y:用於指定x和y軸的邊距值。這些隻能單獨使用。
-緊密:布爾
- 如果將此參數指定為True,則認為指定的邊距不需要額外的填充以匹配刻度線。
- 如果將此參數設置為“無”,則將保留原始設置。
下麵給出了使用此函數的各種實現:
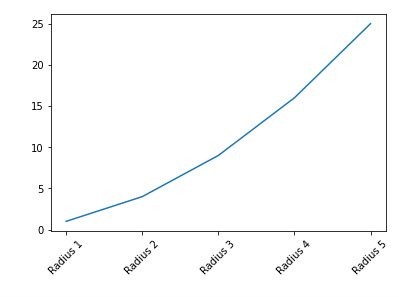
例:一般申請
Python3
import matplotlib.pyplot as plt

x = [1, 2, 3, 4, 5]
labels = ['Radius 1', 'Radius 2', 'Radius 3', 'Radius 4', 'Radius 5']
y = [i**2 for i in x]

plt.plot(x, y)
plt.xticks(x, labels, rotation=45)
plt.margins()
plt.show()
輸出:
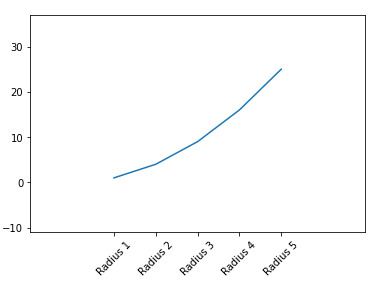
例:將參數傳遞給margins()函數
Python3
import matplotlib.pyplot as plt

x = [1, 2, 3, 4, 5]
labels = ['Radius 1', 'Radius 2', 'Radius 3', 'Radius 4', 'Radius 5']
y = [i**2 for i in x]

plt.plot(x, y)
plt.xticks(x, labels, rotation=45)
plt.margins(0.5)
plt.show()
輸出:
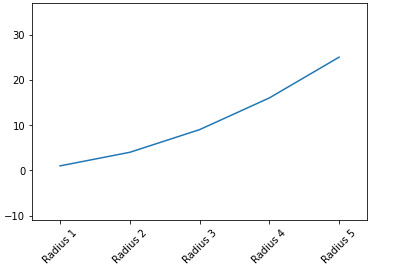
例:傳遞小於1的x和y的不同值,將放大產生的圖形
Python3
import matplotlib.pyplot as plt

x = [1, 2, 3, 4, 5]
labels = ['Radius 1', 'Radius 2', 'Radius 3', 'Radius 4', 'Radius 5']
y = [i**2 for i in x]

plt.plot(x, y)
plt.xticks(x, labels, rotation=45)
plt.margins(x=0.1, y=0.5)
plt.show()
輸出:
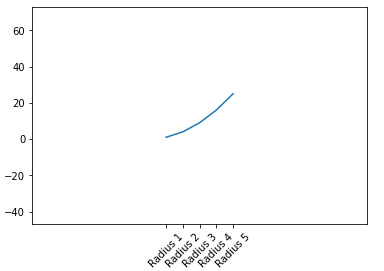
例:為x和y傳遞大於的不同值,將縮小生成的圖形
Python3
import matplotlib.pyplot as plt

x = [1, 2, 3, 4, 5]
labels = ['Radius 1', 'Radius 2', 'Radius 3', 'Radius 4', 'Radius 5']
y = [i**2 for i in x]

plt.plot(x, y)
plt.xticks(x, labels, rotation=45)
plt.margins(x=2, y=2)
plt.show()
輸出:
相關用法
- Python Wand function()用法及代碼示例
- Python Sorted()用法及代碼示例
- Python Numbers choice()用法及代碼示例
- Python Tkinter askopenfile()用法及代碼示例
- Python round()用法及代碼示例
- Python id()用法及代碼示例
注:本文由純淨天空篩選整理自soumibardhan10大神的英文原創作品 Matplotlib.pyplot.margins() function in Python。非經特殊聲明,原始代碼版權歸原作者所有,本譯文未經允許或授權,請勿轉載或複製。