先決條件:Matplotlib
Matplotlib是一個綜合庫,用於在python中創建交互式,靜態和動畫可視化。使用wxPython,SciPy,Tkinter或SciPy之類的general-purpose GUI工具包,它提供了一個麵向對象的API,用於將圖嵌入到應用程序中。 Matplotlib.pyplot是使Matplotlib像MATLAB一樣工作的函數集合。
在這裏,我們將探索Matplotlib.pyplot的loglog()函數。它用於在x和y軸上繪製對數刻度。
用法:
loglog(X,Y)
其中,
X和Y分別指x和y坐標。
使用的其他函數是linespace()。它在指定的間隔內返回均等的數字。
用法:
np.linspace(start, stop, num, endpoint, retstep, dtype, axis)
其中,
- Start :您要顯示線條的位置的序列起始值,或者我們可以說線條的起點
- Stop:除非‘endpoint’設置為False,否則它是行停止處序列的結束值。
- Num:要生成的樣本數。必須為非負數。默認情況下為50。
- Endpoint:與停止相同。如果為True,則stop是最後一個樣本,否則stop將從序列中排除。
- Retstep:如果為True,則返回(‘samples’, ‘step’),其中`step`是樣本之間的間隔。
- Dtype:輸出數組的類型。
- Axis :結果中存儲樣本的軸,僅當開始或停止為array-like時才相關
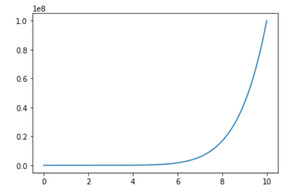
例:沒有loglog()
Python
# importing requried modules
import matplotlib.pyplot as plt
import numpy as np


# inputs to plot using loglog plot
x_input = np.linspace(0, 10, 50000)

y_input = x_input**8

# plotting the value of x_input and y_input using plot function
plt.plot(x_input, y_input)
輸出:
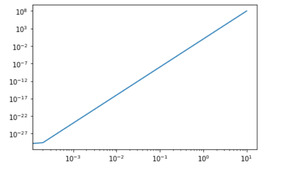
例:與loglog()
Python3
# importing requried modules
import matplotlib.pyplot as plt
import numpy as np


# inputs to plot using loglog plot
x_input = np.linspace(0, 10, 50000)

y_input = x_input**8

# plotting the value of x_input and y_input using loglog plot
plt.loglog(x_input, y_input)
輸出:
相關用法
- Python Wand function()用法及代碼示例
- Python Sorted()用法及代碼示例
- Python Numbers choice()用法及代碼示例
- Python Tkinter askopenfile()用法及代碼示例
- Python ord()用法及代碼示例
- Python round()用法及代碼示例
- Python id()用法及代碼示例
注:本文由純淨天空篩選整理自tushardhiman1999大神的英文原創作品 Matplotlib.pyplot.loglog() function in Python。非經特殊聲明,原始代碼版權歸原作者所有,本譯文未經允許或授權,請勿轉載或複製。