Matplotlib是一個Python庫,用於使用Pyplot創建,製作動畫以及編輯圖形,曲線圖和圖形。 Matplotlib.pyplot根據用戶的喜好和要求,定義了許多要使用的函數。
matplotlib.pyplot.figlegend()函數
這用於在圖上放置圖例。 Matplotlib中的圖例類似於定義圖中固化方法的銘牌。
用法: matplotlib.pyplot.figlegend(*args, **kwargs)
參數:some important parameters are:
- 處理:所有圖形線的列表(或在技術術語“藝術家”中)將要添加到圖例的藝術家(線,補丁)列表作為不同的手柄。在figlend()中指定句柄是可選的。
- 標簽:圖例的實際名稱列表用來顯示Artist實際值的標簽列表稱為標簽。在figlend()中指定標簽是可選的,如果未指定標簽,則figlend()函數將其命名為Legend 1,Legend 2,依此類推。
- 位置:圖例的位置(默認值:‘best’)。
返回:返回圖例。
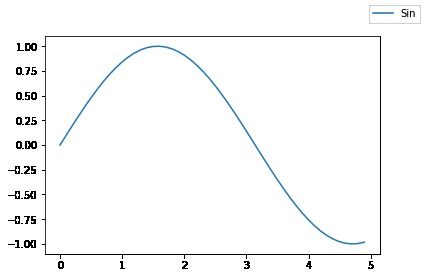
範例1:創建了一個數據集x,其值x = [0,0.1,0.2,…。,5]且y = sin(x),然後用標簽= =繪製了數據集x在x軸和y在y軸的圖形。 “ Sin”,並使用默認的figlegend()與該圖一起繪製,並使用之前指定的標簽作為圖例。
Python3
# Importing the necessary modules
import numpy as np
import matplotlib.pyplot as plt

# Creating a dataset
x = np.arange(0, 5, 0.1)
y = np.sin(x)

# Plotting the data
plt.plot(x, y, label = "Sin")

# Legend
plt.figlegend()
輸出:
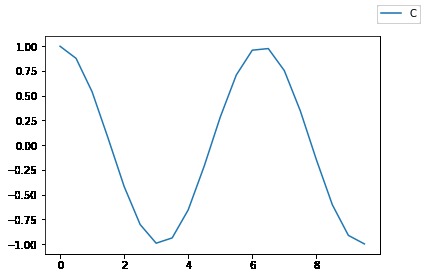
範例2:使用與上述相同的方法,但顯示使用figlegend()句柄和標簽,但使用默認位置。
Python3
# Importing the necessary modules
import numpy as np
import matplotlib.pyplot as plt

# Creating a dataset
x = np.arange(0, 5, 0.1)
y = np.cos(x)

# Plotting the data
line1 = plt.plot(x, y)

# Legend
plt.figlegend((line1),('Cos'))
輸出:
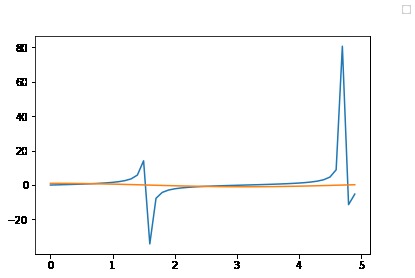
範例3:通過在tan和cos函數的一個圖上繪製兩個圖形來顯示figlegend(句柄,標簽,位置)函數的使用。
Python3
# Importing the necessary modules
import numpy as np
import matplotlib.pyplot as plt

# Creating a dataset
x = np.arange(0, 5, 0.1)
y = np.tan(x)

x1 = np.arange(0, 5, 0.1)
y1 = np.cos(x)

# Plotting the data
line1 = plt.plot(x, y)
line2 = plt.plot(x1, y1)

# Legend
plt.figlegend(
handles = (line1,line2),
          labels = ("Tan","Cos"),
          loc='upper right')
輸出:
相關用法
- Python Wand function()用法及代碼示例
- Python Sorted()用法及代碼示例
- Python Numbers choice()用法及代碼示例
- Python Tkinter askopenfile()用法及代碼示例
- Python ord()用法及代碼示例
- Python sum()用法及代碼示例
- Python round()用法及代碼示例
- Python id()用法及代碼示例
- Python vars()用法及代碼示例
注:本文由純淨天空篩選整理自samrat2825大神的英文原創作品 Matplotlib.pyplot.figlegend() function in Python。非經特殊聲明,原始代碼版權歸原作者所有,本譯文未經允許或授權,請勿轉載或複製。