Matplotlib是Python中的一個庫,它是數字的-NumPy庫的數學擴展。 Pyplot是Matplotlib模塊的基於狀態的接口,該模塊提供了MATLAB-like接口。
matplotlib.pyplot.axhline()函數
matplotlib庫的pyplot模塊中的axhline()函數用於在軸上添加一條水平線。
用法: matplotlib.pyplot.axhline(y=0, xmin=0, xmax=1, **kwargs)
參數:此方法接受以下描述的參數:
- y:該參數是可選的,它是在水平線的數據坐標中的位置。
- xmin:此參數是標量,是可選的。其默認值為0。
- xmax:此參數是標量,是可選的。默認值為1。
返回值:這將返回以下內容:
- line:這將返回此函數創建的行。
以下示例說明了matplotlib.pyplot中的matplotlib.pyplot.axhline()函數:
範例1:
# Implementation of matplotlib.pyplot.annotate() function
import numpy as np
import matplotlib.pyplot as plt
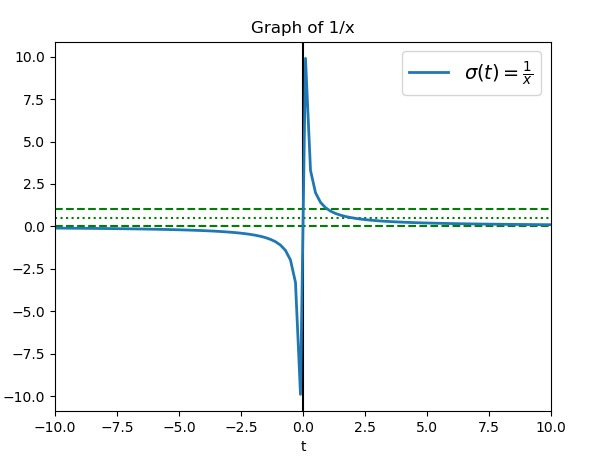
t = np.linspace(-10, 10, 100)
sig = 1 / t
plt.axhline(y = 0, color ="green", linestyle ="--")
plt.axhline(y = 0.5, color ="green", linestyle =":")
plt.axhline(y = 1.0, color ="green", linestyle ="--")
plt.axvline(color ="black")
plt.plot(t, sig, linewidth = 2,
label = r"$\sigma(t) = \frac{1}{x}$")
plt.xlim(-10, 10)
plt.xlabel("t")
plt.title("Graph of 1 / x")
plt.legend(fontsize = 14)
plt.show()輸出:
範例2:
# Implementation of matplotlib.pyplot.annotate()
# function

import numpy as np
import matplotlib.pyplot as plt

x = np.linspace(0, 13, 100)

plt.rcParams['lines.linewidth'] = 2
plt.figure()

plt.plot(x, np.sin(x), label ='Line1',
         color ='green', linestyle ="--")

plt.plot(x, np.sin(x + 0.5), label ='Line2',
         color ='black', linestyle =":")

plt.axhline(0, label ='Line3', color ='black')


plt.title('Axhline() Example')
l = plt.legend(loc ='upper right')

# legend between blue and orange
# line
l.set_zorder(2.5)

plt.show()
輸出:

相關用法
注:本文由純淨天空篩選整理自SHUBHAMSINGH10大神的英文原創作品 matplotlib.pyplot.axhline() in Python。非經特殊聲明,原始代碼版權歸原作者所有,本譯文未經允許或授權,請勿轉載或複製。