Pyplot是matplotlib的另一個模塊,它使用戶能夠將MATLAB集成到Python環境中,從而提供類似MATLAB的接口,並使Python在視覺上具有交互性。
Matplotlib.pyplot.axes()
pyplot.axes是matplotlib庫的函數,該函數將軸添加到當前圖形並將其作為當前軸。其輸出取決於所使用的參數。
用法: matplotlib.pyplot.axes(*args, **kwargs)
參數:
*args:它可能包含None(nothing)或4個float類型的元組
- none:它給出了一個新的全窗口軸
- 4個元組:它以4個元組作為列表,即[左底部寬度高度],並給出這些尺寸的窗口作為軸。
** kwargs:有多個關鍵字參數(kwargs)用作pyplot.axes()的參數,最常見的包括facecolor,gid,in_layout,label,position,xlim,ylim等。
範例1:
# importing matplot library along
# with necessary modules
import matplotlib.pyplot as plt
# providing values to x and y
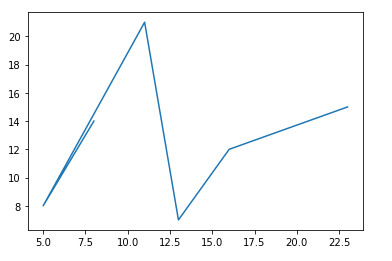
x = [8, 5, 11, 13, 16, 23]
y = [14, 8, 21, 7, 12, 15]
# to plot x and y
plt.plot(x, y)
# to generate the full window axes
plt.axes()輸出:
範例2:
# importing matplot library along
# with necessary modules
import matplotlib.pyplot as plt


# providing values to x and y
x = [8, 5, 11, 13, 16, 23]
y = [14, 8, 21, 7, 12, 15]

# to plot x and y
#plt.plot(x, y)
# to generate window of custom
# dimensions [left, bottom, width,
# height] along with the facecolor
plt.axes([0, 2.0, 2.0, 2.0], facecolor = 'black')
輸出:
注:本文由純淨天空篩選整理自afshan_mairaj大神的英文原創作品 Matplotlib.pyplot.axes() in Python。非經特殊聲明,原始代碼版權歸原作者所有,本譯文未經允許或授權,請勿轉載或複製。