Matplotlib是Python中的一個庫,它是數字的-NumPy庫的數學擴展。 Pyplot是Matplotlib模塊的基於狀態的接口,該模塊提供了MATLAB-like接口。
matplotlib.pyplot.annotate()函數
matplotlib庫的pyplot模塊中的annotate()函數用於用文本s注釋點xy。
用法: angle_spectrum(x, Fs=2, Fc=0, window=mlab.window_hanning, pad_to=None, sides=’default’, **kwargs)
參數:此方法接受以下描述的參數:
- s:此參數是注釋的文本。
- xy:此參數是要注釋的點(x,y)。
- xytext:此參數是可選參數。它是放置文本的位置(x,y)。
- xycoords:此參數也是可選參數,包含字符串值。
- textcoords:此參數包含字符串值。xytext的坐標係,可能與xy所使用的坐標係不同
- arrowprops:該參數也是可選參數,包含dict類型,默認值為None。
- annotation_clip:該參數也是可選參數,包含布爾值,其默認值為None,其行為為True。
返回值:此方法返回注釋。
以下示例說明了matplotlib.pyplot中的matplotlib.pyplot.annotate()函數:
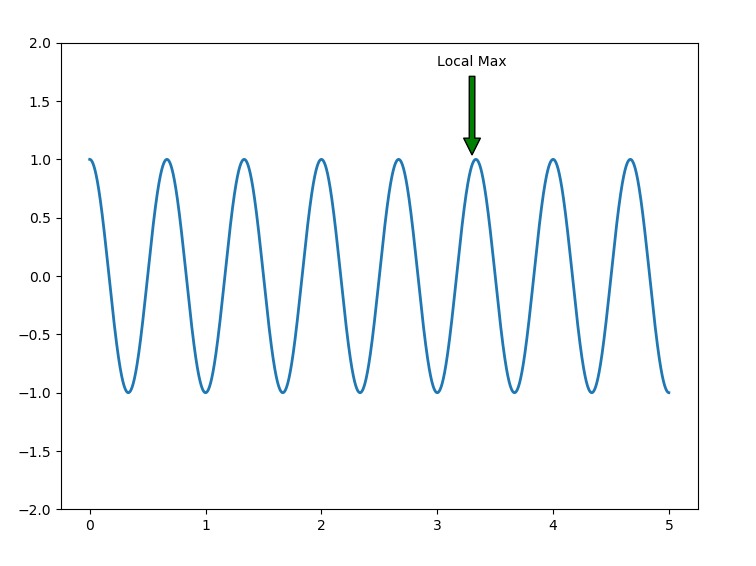
範例1:
# Implementation of matplotlib.pyplot.annotate()
# function

import matplotlib.pyplot as plt
import numpy as np


fig, geeeks = plt.subplots()

t = np.arange(0.0, 5.0, 0.001)
s = np.cos(3 * np.pi * t)
line = geeeks.plot(t, s, lw = 2)

# Annotation
geeeks.annotate('Local Max', xy =(3.3, 1),
                xytext =(3, 1.8),
                arrowprops = dict(facecolor ='green',
                                  shrink = 0.05),)

geeeks.set_ylim(-2, 2)

# Plot the Annotation in the graph
plt.show()
輸出:
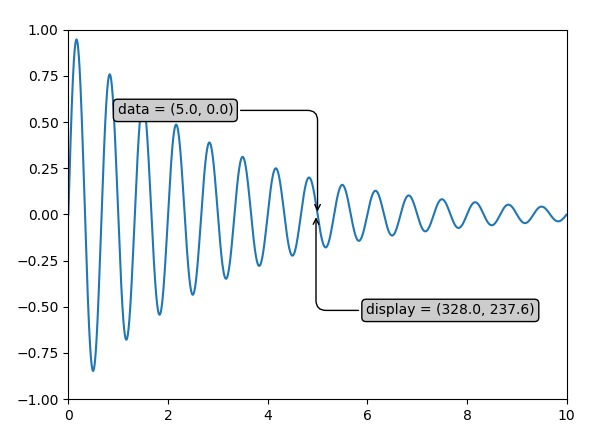
範例2:
# Implementation of matplotlib.pyplot.annotate()
# function

import numpy as np
import matplotlib.pyplot as plt

x = np.arange(0, 10, 0.005)
y = np.exp(-x / 3.) * np.sin(3 * np.pi * x)

fig, ax = plt.subplots()
ax.plot(x, y)
ax.set_xlim(0, 10)
ax.set_ylim(-1, 1)

# Setting up the parameters
xdata, ydata = 5, 0
xdisplay, ydisplay = ax.transData.transform((xdata, ydata))

bbox = dict(boxstyle ="round", fc ="0.8")
arrowprops = dict(
    arrowstyle = "->",
    connectionstyle = "angle, angleA = 0, angleB = 90,\
    rad = 10")

offset = 72

# Annotation
ax.annotate('data = (%.1f, %.1f)'%(xdata, ydata),
            (xdata, ydata), xytext =(-2 * offset, offset),
            textcoords ='offset points',
            bbox = bbox, arrowprops = arrowprops)


disp = ax.annotate('display = (%.1f, %.1f)'%(xdisplay, ydisplay),
            (xdisplay, ydisplay), xytext =(0.5 * offset, -offset),
            xycoords ='figure pixels',
            textcoords ='offset points',
            bbox = bbox, arrowprops = arrowprops)

# To display the annotation
plt.show()
輸出:
相關用法
注:本文由純淨天空篩選整理自SHUBHAMSINGH10大神的英文原創作品 Matplotlib.pyplot.annotate() in Python。非經特殊聲明,原始代碼版權歸原作者所有,本譯文未經允許或授權,請勿轉載或複製。