Matplotlib是Python中的一個庫,它是數字的-NumPy庫的數學擴展。 Figure模塊提供了頂層Artist,即Figure,其中包含所有繪圖元素。此模塊用於控製所有圖元的子圖和頂層容器的默認間距。
matplotlib.figure.Figure.suptitle()方法
matplotlib庫的suptitle()方法圖形模塊用於向圖形添加居中標題。
用法:suptitle(self, t, **kwargs)
參數:此方法接受下麵討論的以下參數:
- t:此參數是標題文本。
- x:此參數是圖形坐標中文本的x位置。
- y:此參數是圖形坐標中文本的y位置。
- horizontalalignment, ha:此參數是文本相對於(x,y)的水平對齊方式。
- verticalalignment, va:此參數是文本相對於(x,y)的垂直對齊方式。
- fontsize, size:此參數是文本的字體大小。
- fontweight, weight:此參數是文本的字體粗細。
返回值:此方法返回標題的Text實例。
以下示例說明了matplotlib.figure中的matplotlib.figure.Figure.suptitle()函數:
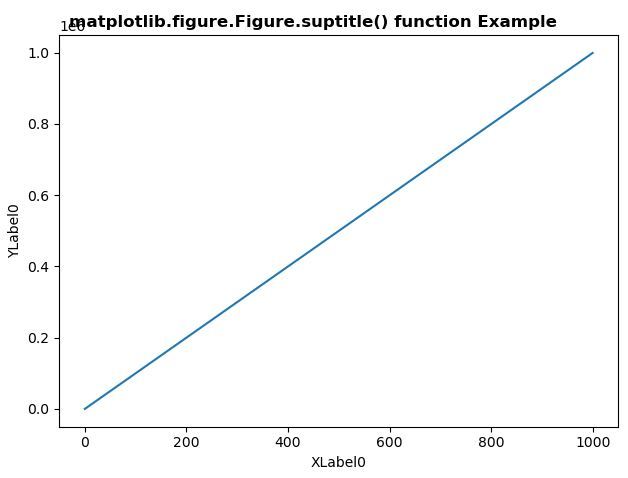
範例1:
# Implementation of matplotlib function
import matplotlib.pyplot as plt
import numpy as np
import matplotlib.gridspec as gridspec


fig = plt.figure(tight_layout = True)
gs = gridspec.GridSpec(1, 1)

ax = fig.add_subplot(gs[0,:])
ax.plot(np.arange(0, 1e6, 1000))
ax.set_ylabel('YLabel0')
ax.set_xlabel('XLabel0')

fig.suptitle('matplotlib.figure.Figure.suptitle()\
 function Example\n\n', fontweight ="bold")

plt.show()
輸出:
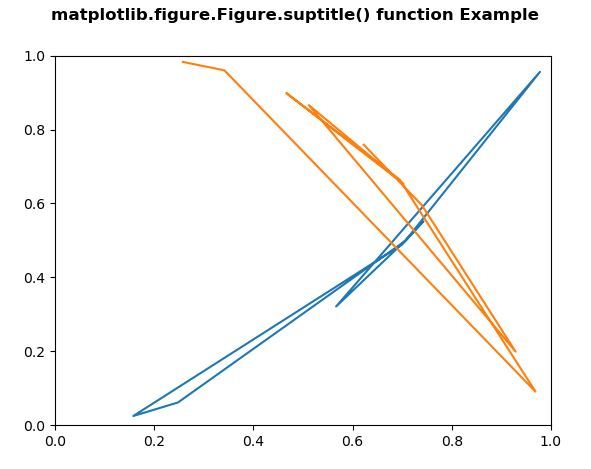
範例2:
# Implementation of matplotlib function
import matplotlib.pyplot as plt
import numpy as np


np.random.seed(19680801)

xdata = np.random.random([2, 10])

xdata1 = xdata[0,:]
xdata2 = xdata[1,:]

ydata1 = xdata1 ** 2
ydata2 = 1 - xdata2 ** 3

fig = plt.figure()
ax = fig.add_subplot(1, 1, 1)
ax.plot(xdata1, ydata1, color ='tab:blue')
ax.plot(xdata2, ydata2, color ='tab:orange')

ax.set_xlim([0, 1])
ax.set_ylim([0, 1])

fig.suptitle('matplotlib.figure.Figure.suptitle()\
 function Example\n\n', fontweight ="bold")

plt.show()
輸出:
相關用法
注:本文由純淨天空篩選整理自SHUBHAMSINGH10大神的英文原創作品 Matplotlib.figure.Figure.suptitle() in Python。非經特殊聲明,原始代碼版權歸原作者所有,本譯文未經允許或授權,請勿轉載或複製。