Matplotlib是Python中的一個庫,它是數字的-NumPy庫的數學擴展。 Figure模塊提供了頂層Artist,即Figure,其中包含所有繪圖元素。此模塊用於控製所有圖元的子圖和頂層容器的默認間距。
matplotlib.figure.Figure.subplots()方法
matplotlib庫的subplots()方法圖形模塊用於顯示圖形窗口。
用法: subplots(self, nrows=1, ncols=1, sharex=False, sharey=False, squeeze=True, subplot_kw=None, gridspec_kw=None)
參數:此方法接受以下描述的參數:
- nrows, ncols:這些參數是子圖網格的行數/列數。
- sharex, sharey:這些參數控製x(共享x)或y(共享)軸之間的屬性共享。
- squeeze:此參數是可選參數,它包含布爾值,默認值為True。
- num:此參數是pyplot.figure關鍵字,用於設置圖形編號或標簽。
- subplot_kwd:此參數是帶有關鍵字的字典,該關鍵字傳遞給用於創建每個子圖的add_subplot調用。
- gridspec_kw:此參數是帶有關鍵字的字典,該關鍵字已傳遞到GridSpec構造函數,該構造函數用於創建放置子圖的網格。
返回值:此方法返回以下值。
- ax:此方法返回axes.Axes對象或Axes對象數組。
以下示例說明了matplotlib.figure中的matplotlib.figure.Figure.subplots()函數:
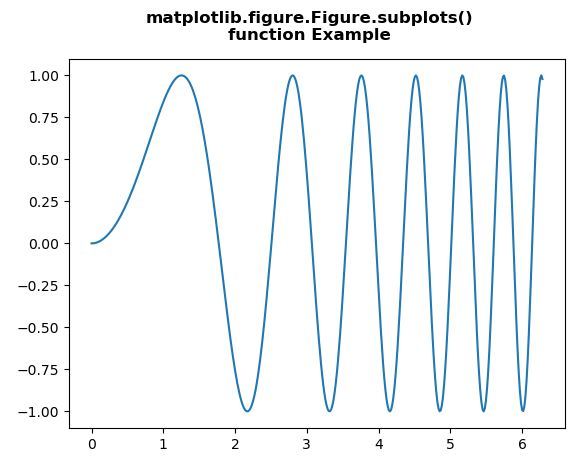
範例1:
# Implementation of matplotlib function
import numpy as np
import matplotlib.pyplot as plt


x = np.linspace(0, 2 * np.pi, 400)
y = np.sin(x**2)

fig = plt.figure()
ax = fig.subplots()

ax.plot(x, y)

fig.suptitle("""matplotlib.figure.Figure.subplots()
function Example\n\n""", fontweight ="bold")

fig.show()
輸出:
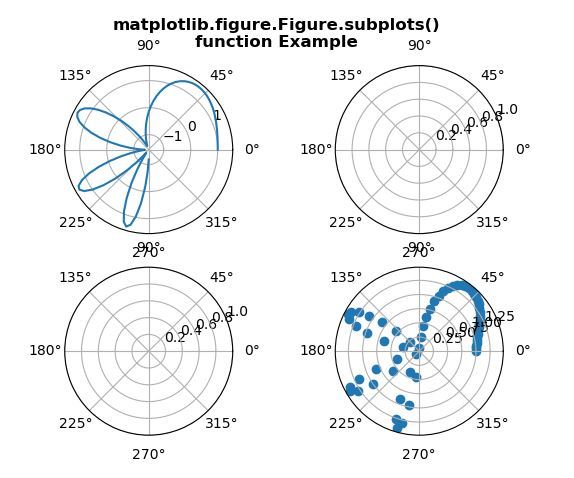
範例2:
# Implementation of matplotlib function
import numpy as np
import matplotlib.pyplot as plt


x = np.linspace(0, 1.5 * np.pi, 100)
y = np.sin(x**2)+np.cos(x**2)

fig = plt.figure()
axs = fig.subplots(2, 2, subplot_kw = dict(polar = True))

axs[0, 0].plot(x, y)
axs[1, 1].scatter(x, y)

fig.suptitle("""matplotlib.figure.Figure.subplots()
function Example\n\n""", fontweight ="bold")

fig.show()
輸出:
相關用法
注:本文由純淨天空篩選整理自SHUBHAMSINGH10大神的英文原創作品 Matplotlib.figure.Figure.subplots() in Python。非經特殊聲明,原始代碼版權歸原作者所有,本譯文未經允許或授權,請勿轉載或複製。