Matplotlib是Python中的一個庫,它是數字的-NumPy庫的數學擴展。 Figure模塊提供了頂層Artist,即Figure,其中包含所有繪圖元素。此模塊用於控製所有圖元的子圖和頂層容器的默認間距。
matplotlib.figure.Figure.set_constrained_layout_pads()方法
matplotlib庫的set_constrained_layout_pads()方法圖形模塊用於設置constrained_layout的填充。
用法:set_constrained_layout_pads(self, **kwargs)
參數:此方法接受下麵討論的以下參數:
- w_pad:此參數是以英寸為單位的寬度填充。
- h_pad:此參數是以英寸為單位的高度填充。
- wspace:此參數是子圖之間的寬度填充,表示為子圖寬度的一部分。
- hspace:此參數是子圖之間的高度填充,表示為子圖寬度的一部分。
返回值:此方法不返回任何值。
以下示例說明了matplotlib.figure中的matplotlib.figure.Figure.set_constrained_layout_pads()函數:
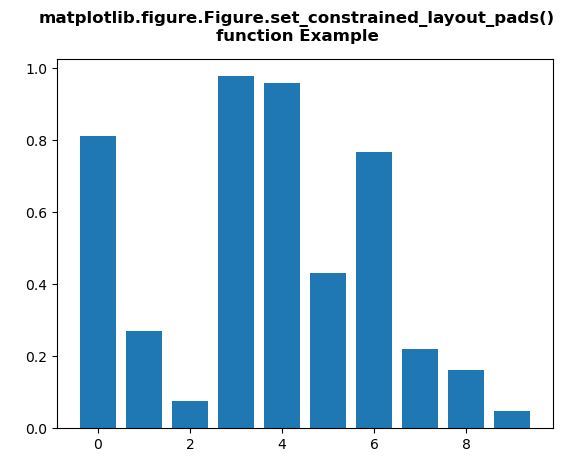
範例1:
# Implementation of matplotlib function
import matplotlib.pyplot as plt
from matplotlib.lines import Line2D
import numpy as np
from numpy.random import rand


fig, ax2 = plt.subplots()

ax2.bar(range(10), rand(10), picker = True)
for label in ax2.get_xticklabels():
    label.set_picker(True)

def onpick1(event):

    if isinstance(event.artist, Line2D):
        thisline = event.artist
        xdata = thisline.get_xdata()
        ydata = thisline.get_ydata()
        ind = event.ind
        print('onpick1 line:', np.column_stack([xdata[ind], ydata[ind]]))

    elif isinstance(event.artist, Rectangle):
        patch = event.artist
        print('onpick1 patch:', patch.get_path())

    elif isinstance(event.artist, Text):
        text = event.artist
        print('onpick1 text:', text.get_text())

fig.set_constrained_layout_pads(w_pad = 4./72., h_pad = 4./72.,
        hspace = 0., wspace = 0.)

fig.suptitle("""matplotlib.figure.Figure.set_constrained_layout_pads()
function Example\n\n""", fontweight ="bold")

plt.show()
輸出:
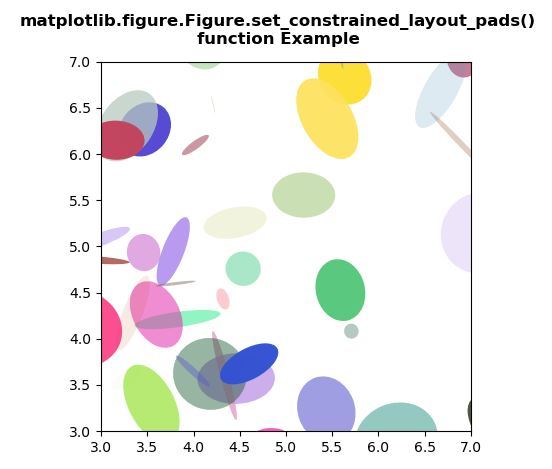
範例2:
# Implementation of matplotlib function
import matplotlib.pyplot as plt
import numpy as np
from matplotlib.patches import Ellipse


NUM = 200

ells = [Ellipse(xy = np.random.rand(2) * 10,
                width = np.random.rand(),
                height = np.random.rand(),
                angle = np.random.rand() * 360)
        for i in range(NUM)]

fig, ax = plt.subplots(subplot_kw ={'aspect':'equal'})

for e in ells:
    ax.add_artist(e)
    e.set_clip_box(ax.bbox)
    e.set_alpha(np.random.rand())
    e.set_facecolor(np.random.rand(4))

ax.set_xlim(3, 7)
ax.set_ylim(3, 7)

fig.set_constrained_layout_pads(w_pad = 2./72., h_pad = 2./72.,
        hspace = 0., wspace = 0.)

fig.suptitle("""matplotlib.figure.Figure.set_constrained_layout_pads()
function Example\n\n""", fontweight ="bold")

plt.show()
輸出:
注:本文由純淨天空篩選整理自SHUBHAMSINGH10大神的英文原創作品 Matplotlib.figure.Figure.set_constrained_layout_pads() in Python。非經特殊聲明,原始代碼版權歸原作者所有,本譯文未經允許或授權,請勿轉載或複製。