Matplotlib是Python中的一個庫,它是數字的-NumPy庫的數學擴展。 Figure模塊提供了頂層Artist,即Figure,其中包含所有繪圖元素。此模塊用於控製所有圖元的子圖和頂層容器的默認間距。
matplotlib.figure.Figure.set_constrained_layout()方法
matplotlib庫的set_constrained_layout()方法圖形模塊用於設置在繪製時是否使用constrained_layout。
用法:set_constrained_layout(self, constrained)
參數:此方法接受下麵討論的以下參數:
- constrained:此參數是bool或dict或None。
返回值:此方法返回軸。
以下示例說明了matplotlib.figure中的matplotlib.figure.Figure.set_constrained_layout()函數:
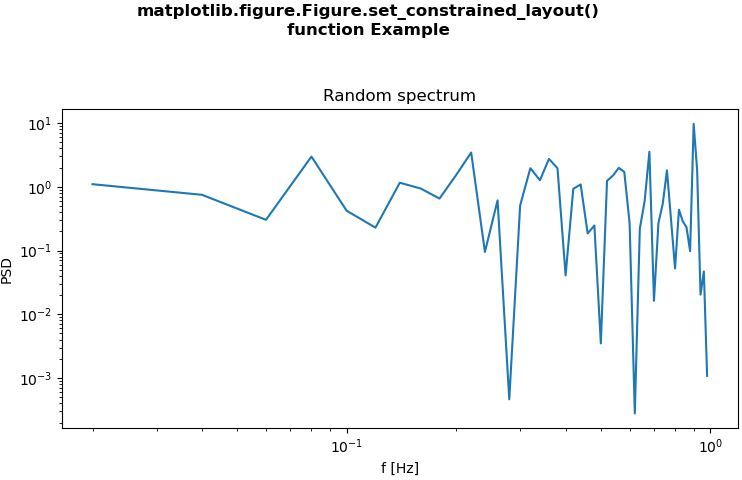
範例1:
# Implementation of matplotlib function
import numpy as np
import matplotlib.pyplot as plt


fig, ax = plt.subplots(constrained_layout = True)
x = np.arange(0.02, 1, 0.02)

np.random.seed(19680801)
y = np.random.randn(len(x)) ** 2

ax.loglog(x, y)

ax.set_xlabel('f [Hz]')
ax.set_ylabel('PSD')
ax.set_title('Random spectrum')


def forward(x):
    return 1 / x


def inverse(x):
    return 1 / x

fig.set_constrained_layout(True)

fig.suptitle("""matplotlib.figure.Figure.set_constrained_layout()
function Example\n\n""", fontweight ="bold")

plt.show()
輸出:
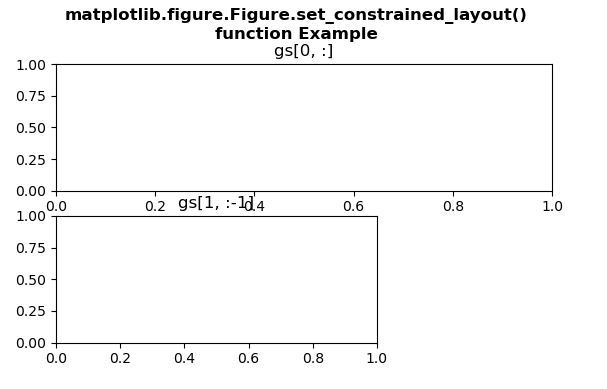
範例2:
# Implementation of matplotlib function
import matplotlib
import matplotlib.pyplot as plt
import matplotlib.gridspec as gridspec


fig = plt.figure()
gs = fig.add_gridspec(3, 3)
ax = fig.add_subplot(gs[0,:])

ax.set_title('gs[0,:]')
ax2 = fig.add_subplot(gs[1,:-1])
ax2.set_title('gs[1,:-1]')

fig.set_constrained_layout(False)

fig.suptitle("""matplotlib.figure.Figure.set_constrained_layout()
function Example\n\n""", fontweight ="bold")

plt.show()
輸出:
相關用法
注:本文由純淨天空篩選整理自SHUBHAMSINGH10大神的英文原創作品 Matplotlib.figure.Figure.set_constrained_layout() in Python。非經特殊聲明,原始代碼版權歸原作者所有,本譯文未經允許或授權,請勿轉載或複製。