Matplotlib是Python中的一個庫,它是數字的-NumPy庫的數學擴展。 Figure模塊提供了頂層Artist,即Figure,其中包含所有繪圖元素。此模塊用於控製所有圖元的子圖和頂層容器的默認間距。
matplotlib.figure.Figure.add_subplot()函數
matplotlib庫的add_subplot()方法圖形模塊用於將圖形軸添加為圖形,作為子圖布置的一部分。
用法: add_subplot(self, *args, **kwargs)
參數:這接受以下描述的以下參數:
- projection:此參數是軸的投影類型。
- sharex, sharey:這些參數與sharex和/或sharey共享x或y軸。
- label:該參數是返回軸的標簽。
返回值:此方法返回子圖的軸。
以下示例說明了matplotlib.figure中的matplotlib.figure.Figure.add_subplot()函數:
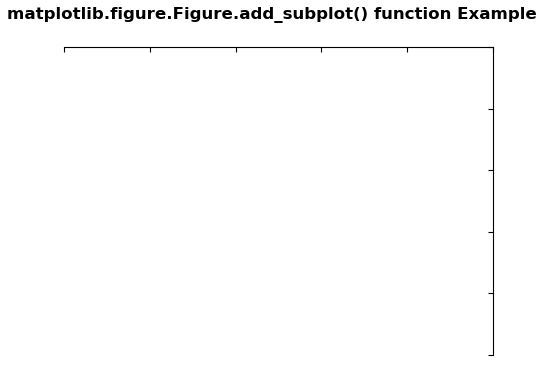
範例1:
# Implementation of matplotlib function
import matplotlib.pyplot as plt
from mpl_toolkits.axisartist.axislines import Subplot


fig = plt.figure(figsize =(4, 4))

ax = Subplot(fig, 111)
fig.add_subplot(ax)

ax.axis["left"].set_visible(False)
ax.axis["bottom"].set_visible(False)

fig.suptitle('matplotlib.figure.Figure.add_subplot() \
function Example\n\n', fontweight ="bold")

plt.show()
輸出:
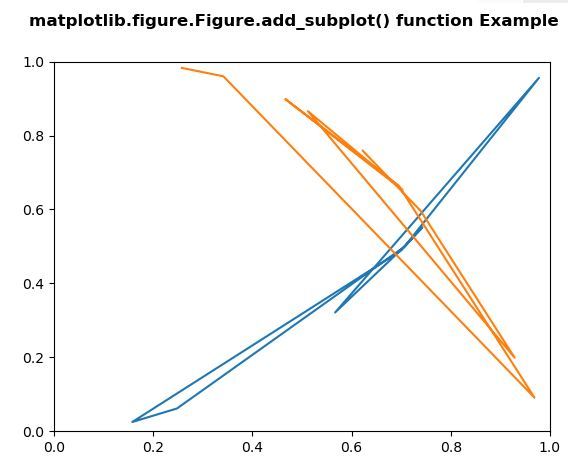
範例2:
# Implementation of matplotlib function
import matplotlib.pyplot as plt
import numpy as np


np.random.seed(19680801)

xdata = np.random.random([2, 10])

xdata1 = xdata[0,:]
xdata2 = xdata[1,:]

ydata1 = xdata1 ** 2
ydata2 = 1 - xdata2 ** 3

fig = plt.figure()
ax = fig.add_subplot(1, 1, 1)
ax.plot(xdata1, ydata1, color ='tab:blue')
ax.plot(xdata2, ydata2, color ='tab:orange')

ax.set_xlim([0, 1])
ax.set_ylim([0, 1])
fig.suptitle('matplotlib.figure.Figure.add_subplot() \
function Example\n\n', fontweight ="bold")

plt.show()
輸出:
相關用法
注:本文由純淨天空篩選整理自SHUBHAMSINGH10大神的英文原創作品 Matplotlib.figure.Figure.add_subplot() in Python。非經特殊聲明,原始代碼版權歸原作者所有,本譯文未經允許或授權,請勿轉載或複製。