Matplotlib是Python中的一個庫,它是數字的-NumPy庫的數學擴展。 Figure模塊提供了頂層Artist,即Figure,其中包含所有繪圖元素。此模塊用於控製所有圖元的子圖和頂層容器的默認間距。
matplotlib.figure.Figure.add_axes()函數
matplotlib庫的add_axes()方法圖形模塊用於向圖形添加軸。
用法: add_axes(self, *args, **kwargs)
參數:這接受以下描述的以下參數:
- rect:此參數是新軸的尺寸[左,下,寬度,高度]。
- projection:此參數是軸的投影類型。
- sharex, sharey:這些參數與sharex和/或sharey共享x或y軸。
- label:該參數是返回軸的標簽。
返回值:此方法返回的軸類取決於所使用的投影。
以下示例說明了matplotlib.figure中的matplotlib.figure.Figure.add_axes()函數:
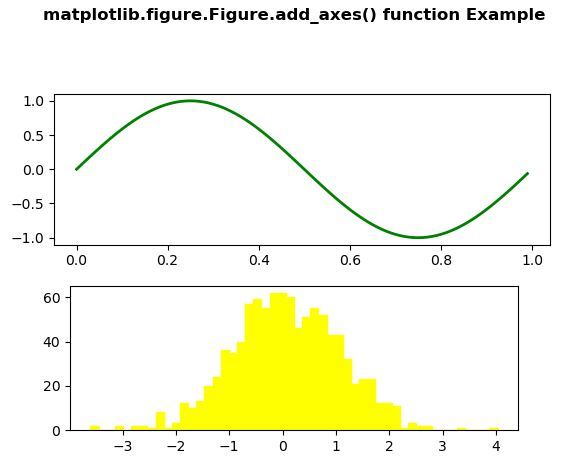
範例1:
# Implementation of matplotlib function
import numpy as np
import matplotlib.pyplot as plt


fig = plt.figure()
fig.subplots_adjust(top = 0.8)
ax1 = fig.add_subplot(211)

t = np.arange(0.0, 1.0, 0.01)
s = np.sin(2 * np.pi * t)
line, = ax1.plot(t, s, color ='green', lw = 2)

np.random.seed(19680801)

ax2 = fig.add_axes([0.15, 0.1, 0.7, 0.3])
n, bins, patches = ax2.hist(np.random.randn(1000), 50,
                            facecolor ='yellow',
                            edgecolor ='yellow')

fig.suptitle('matplotlib.figure.Figure.add_axes() \
function Example\n\n', fontweight ="bold")

plt.show()
輸出:
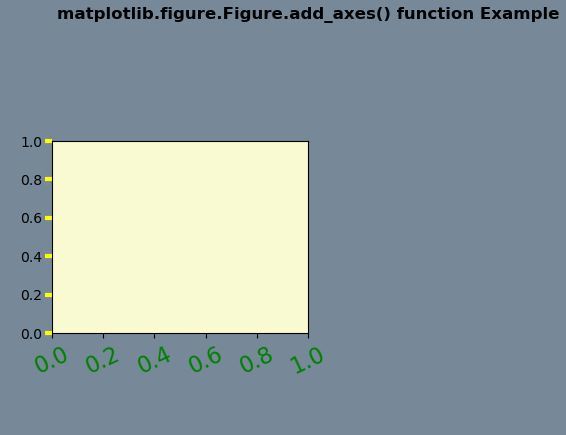
示例2:
# Implementation of matplotlib function
import numpy as np
import matplotlib.pyplot as plt

fig = plt.figure()
rect = fig.patch
rect.set_facecolor('lightslategray')

ax1 = fig.add_axes([0.1, 0.3, 0.4, 0.4])
rect = ax1.patch
rect.set_facecolor('lightgoldenrodyellow')


for label in ax1.xaxis.get_ticklabels():
    label.set_color('green')
    label.set_rotation(25)
    label.set_fontsize(16)

for line in ax1.yaxis.get_ticklines():
    line.set_color('yellow')
    line.set_markersize(5)
    line.set_markeredgewidth(3)

fig.suptitle('matplotlib.figure.Figure.add_axes() \
function Example\n\n', fontweight ="bold")

plt.show()
輸出:
相關用法
注:本文由純淨天空篩選整理自SHUBHAMSINGH10大神的英文原創作品 Matplotlib.figure.Figure.add_axes() in Python。非經特殊聲明,原始代碼版權歸原作者所有,本譯文未經允許或授權,請勿轉載或複製。