Matplotlib是Python中令人驚歎的可視化庫,用於二維陣列圖。 Matplotlib是一個基於NumPy數組的多平台數據可視化庫,旨在與更廣泛的SciPy堆棧配合使用。
matplotlib.colors.to_hex()
的matplotlib.colors.to_hex()函數用於將0到1之間的數字轉換為十六進製顏色代碼。它使用#rrggbb如果keep_alpha設置為False(也是默認值),則使用其他格式#rrggbbaa。
用法: matplotlib.colors.to_hex(c, keep_alpha=False)
參數:
- c:這表示介於0到1之間的顏色序列數組。
- keep_alpha:如果設置為True,則使用#rrggbbaa格式,否則使用#rrggbb格式,並且僅接受布爾值。
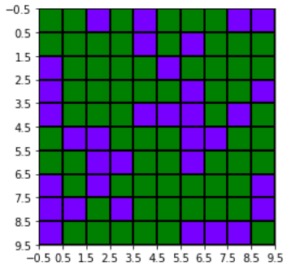
範例1:
import matplotlib.pyplot as plt
from matplotlib import colors
import numpy as np

# dummy data to build the grid
data = np.random.rand(10, 10) * 20

# converting into hex color code
hex_color=matplotlib.colors.to_hex([ 0.47,
                                    0.0,
                                    1.0 ])

# create discrete colormap
cmap = colors.ListedColormap([hex_color,
                              'green'])

bounds = [0,10,20]
norm = colors.BoundaryNorm(bounds, cmap.N)

fig, ax = plt.subplots()
ax.imshow(data, cmap=cmap, norm=norm)

# draw gridlines
ax.grid(which='major', axis='both',
        linestyle='-', color='k',
        linewidth=2)

ax.set_xticks(np.arange(-.5, 10, 1));
ax.set_yticks(np.arange(-.5, 10, 1));

plt.show()
輸出:
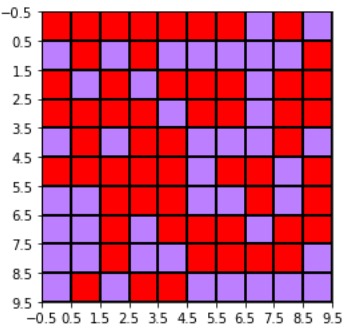
範例2:
import matplotlib.pyplot as plt
from matplotlib import colors
import numpy as np

# dummy data to build the grid
data = np.random.rand(10, 10) * 20

# converting into hex color
# code with alpha set to True
hex_color = matplotlib.colors.to_hex([ 0.47,
                                      0.0,
                                      1.0,
                                      0.5 ],
                                     keep_alpha = True)

# create discrete colormap
cmap = colors.ListedColormap([hex_color,
                              'red'])

bounds = [0, 10, 20]
norm = colors.BoundaryNorm(bounds, cmap.N)

fig, ax = plt.subplots()
ax.imshow(data, cmap = cmap, norm = norm)

# draw gridlines
ax.grid(which ='major', axis ='both',
        linestyle ='-', color ='k',
        linewidth = 2)

ax.set_xticks(np.arange(-.5, 10, 1));
ax.set_yticks(np.arange(-.5, 10, 1));

plt.show()
輸出:
相關用法
注:本文由純淨天空篩選整理自RajuKumar19大神的英文原創作品 Matplotlib.colors.to_hex() in Python。非經特殊聲明,原始代碼版權歸原作者所有,本譯文未經允許或授權,請勿轉載或複製。